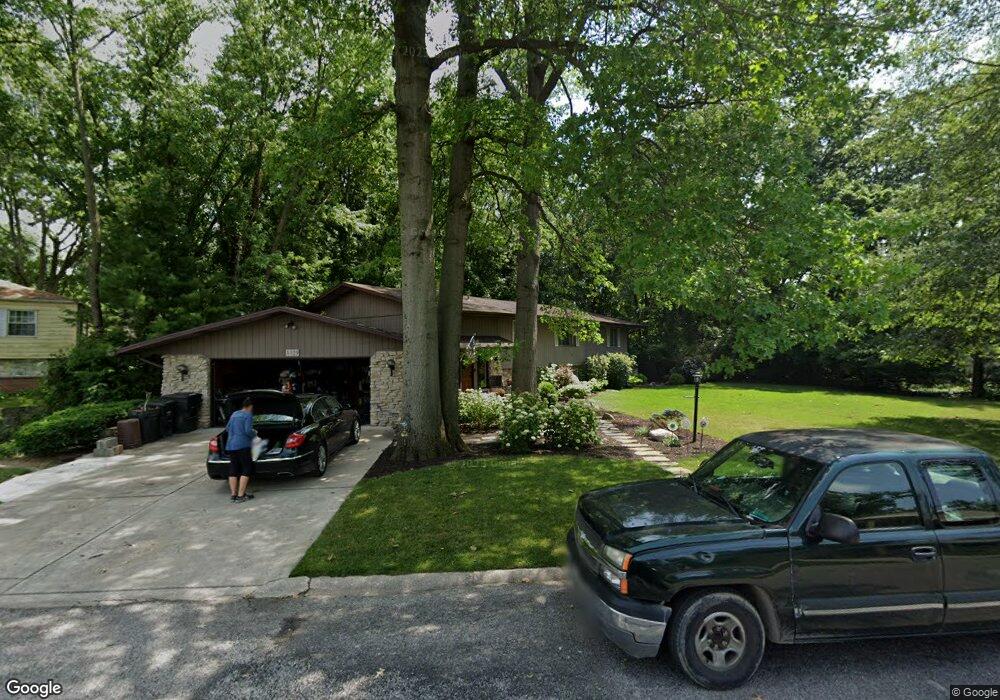
1129 Ocala Ave Lafayette, IN 47905
Central NeighborhoodEstimated Value: $288,000 - $478,000
Studio
--
Bath
1,701
Sq Ft
$219/Sq Ft
Est. Value
About This Home
This home is located at 1129 Ocala Ave, Lafayette, IN 47905 and is currently estimated at $372,663, approximately $219 per square foot. 1129 Ocala Ave is a home located in Tippecanoe County with nearby schools including Oakland Elementary School, Lafayette Tecumseh Junior High School, and Sunnyside Intermediate School.
Ownership History
Date
Name
Owned For
Owner Type
Purchase Details
Closed on
Dec 27, 2006
Sold by
Haby Steven D
Bought by
Haby Steven D and Haby Diane J
Current Estimated Value
Home Financials for this Owner
Home Financials are based on the most recent Mortgage that was taken out on this home.
Original Mortgage
$130,000
Outstanding Balance
$77,817
Interest Rate
6.24%
Mortgage Type
Stand Alone Refi Refinance Of Original Loan
Estimated Equity
$294,846
Purchase Details
Closed on
Nov 7, 2005
Sold by
Bone M Ruth
Bought by
Haby Steven D
Purchase Details
Closed on
Oct 29, 2005
Sold by
Bone M Ruth
Bought by
Haby Steven D
Create a Home Valuation Report for This Property
The Home Valuation Report is an in-depth analysis detailing your home's value as well as a comparison with similar homes in the area
Home Values in the Area
Average Home Value in this Area
Purchase History
| Date | Buyer | Sale Price | Title Company |
|---|---|---|---|
| Haby Steven D | -- | None Available | |
| Haby Steven D | -- | -- | |
| Haby Steven D | -- | -- |
Source: Public Records
Mortgage History
| Date | Status | Borrower | Loan Amount |
|---|---|---|---|
| Open | Haby Steven D | $130,000 |
Source: Public Records
Tax History
| Year | Tax Paid | Tax Assessment Tax Assessment Total Assessment is a certain percentage of the fair market value that is determined by local assessors to be the total taxable value of land and additions on the property. | Land | Improvement |
|---|---|---|---|---|
| 2024 | $3,254 | $325,400 | $52,000 | $273,400 |
| 2023 | $3,099 | $309,200 | $52,000 | $257,200 |
| 2022 | $2,844 | $283,800 | $52,000 | $231,800 |
| 2021 | $2,446 | $243,900 | $52,000 | $191,900 |
| 2020 | $2,234 | $222,700 | $52,000 | $170,700 |
| 2019 | $2,242 | $223,500 | $59,500 | $164,000 |
| 2018 | $2,149 | $214,200 | $59,500 | $154,700 |
| 2017 | $2,071 | $206,500 | $59,500 | $147,000 |
| 2016 | $2,147 | $214,100 | $59,500 | $154,600 |
| 2014 | $1,999 | $199,300 | $59,500 | $139,800 |
| 2013 | $1,983 | $197,700 | $59,500 | $138,200 |
Source: Public Records
Map
Nearby Homes
Your Personal Tour Guide
Ask me questions while you tour the home.