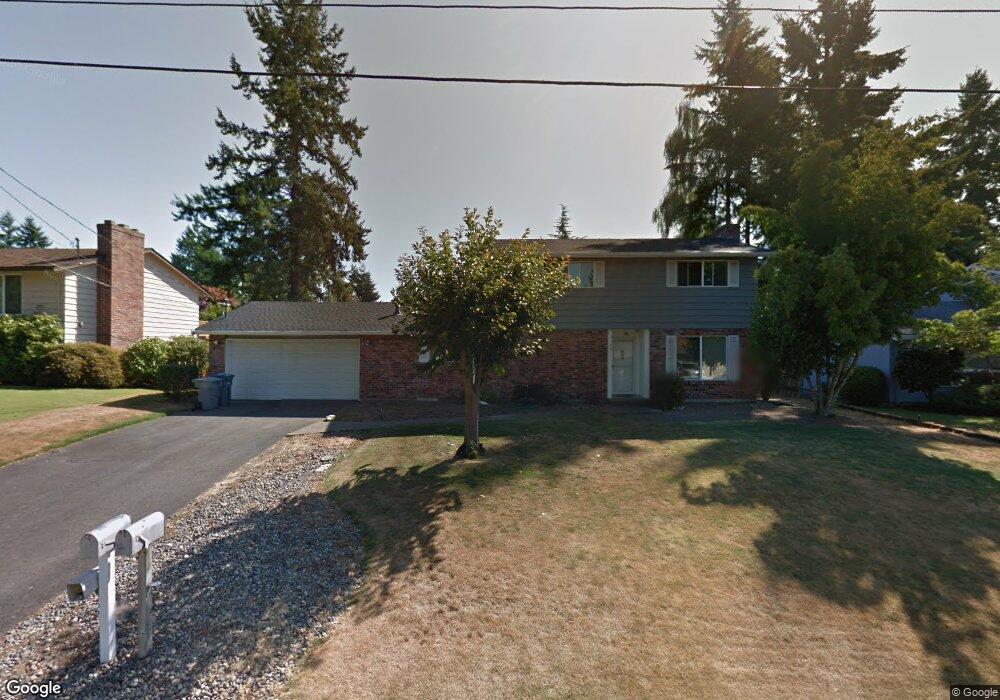
1129 Paradise Pkwy Fircrest, WA 98466
Estimated Value: $594,001 - $636,000
3
Beds
2
Baths
1,663
Sq Ft
$371/Sq Ft
Est. Value
About This Home
This home is located at 1129 Paradise Pkwy, Fircrest, WA 98466 and is currently estimated at $617,250, approximately $371 per square foot. 1129 Paradise Pkwy is a home located in Pierce County with nearby schools including Whittier Elementary School, Wainwright Intermediate School, and Foss High School.
Ownership History
Date
Name
Owned For
Owner Type
Purchase Details
Closed on
Dec 7, 2021
Sold by
Harris Kelly Jeanne and Parker Kelly Jeanne
Bought by
Harris Kelly Jeanne and Fluckinger David Scott
Current Estimated Value
Home Financials for this Owner
Home Financials are based on the most recent Mortgage that was taken out on this home.
Original Mortgage
$356,125
Outstanding Balance
$327,673
Interest Rate
3.14%
Mortgage Type
FHA
Estimated Equity
$289,577
Purchase Details
Closed on
May 14, 2019
Sold by
Parker William Frederick
Bought by
Parker Kelly Jeanne
Purchase Details
Closed on
Nov 16, 2007
Sold by
Delaney Laura E and Delaney Edward A
Bought by
Parker William F and Parker Kelly J
Home Financials for this Owner
Home Financials are based on the most recent Mortgage that was taken out on this home.
Original Mortgage
$281,300
Interest Rate
6.36%
Mortgage Type
Purchase Money Mortgage
Purchase Details
Closed on
Dec 30, 1999
Sold by
Delaney Edward A
Bought by
Delaney Laura E and Delaney Edward A
Create a Home Valuation Report for This Property
The Home Valuation Report is an in-depth analysis detailing your home's value as well as a comparison with similar homes in the area
Home Values in the Area
Average Home Value in this Area
Purchase History
| Date | Buyer | Sale Price | Title Company |
|---|---|---|---|
| Harris Kelly Jeanne | $113,322 | Chicago Title | |
| Parker Kelly Jeanne | -- | None Available | |
| Parker William F | $290,000 | Northpoint Escrow + Title | |
| Delaney Laura E | -- | -- |
Source: Public Records
Mortgage History
| Date | Status | Borrower | Loan Amount |
|---|---|---|---|
| Open | Harris Kelly Jeanne | $356,125 | |
| Previous Owner | Parker William F | $281,300 |
Source: Public Records
Tax History Compared to Growth
Tax History
| Year | Tax Paid | Tax Assessment Tax Assessment Total Assessment is a certain percentage of the fair market value that is determined by local assessors to be the total taxable value of land and additions on the property. | Land | Improvement |
|---|---|---|---|---|
| 2025 | $5,050 | $561,400 | $317,300 | $244,100 |
| 2024 | $5,050 | $553,100 | $298,700 | $254,400 |
| 2023 | $5,050 | $529,400 | $291,000 | $238,400 |
| 2022 | $4,789 | $531,100 | $299,200 | $231,900 |
| 2021 | $4,528 | $389,800 | $210,400 | $179,400 |
| 2019 | $3,482 | $358,400 | $180,100 | $178,300 |
| 2018 | $3,787 | $323,200 | $152,300 | $170,900 |
| 2017 | $3,459 | $284,900 | $123,500 | $161,400 |
| 2016 | $3,195 | $226,300 | $89,800 | $136,500 |
| 2014 | $2,889 | $216,100 | $86,200 | $129,900 |
| 2013 | $2,889 | $193,500 | $77,600 | $115,900 |
Source: Public Records
Map
Nearby Homes
- 1322 W Mount Dr
- 4003 Flora Dr
- 3827 67th Avenue Ct W
- 4221 67th Ave W Unit A
- 1450 Alameda Ave Unit 1
- 4311 67th Ave W Unit B
- 6910 38th Street Ct W Unit 6910
- 3728 70th Avenue Ct W
- 4211 Shoshone St W
- 1310 Boise St Unit 2
- 1324 Boise St
- 914 Alameda Ave
- 7117 40th St W Unit 18
- 4641 67th Avenue Ct W Unit 4643
- 4708 63rd Ave W
- 137 Maple St
- 142 Spruce St
- 106 Holly Ct
- 4920 69th Avenue Ct W
- 4601 73rd Avenue Ct W
- 1125 Paradise Pkwy
- 1133 Paradise Pkwy
- 1226 W Mount Dr
- 1302 W Mount Dr
- 1121 Paradise Pkwy
- 1222 W Mount Dr
- 1306 W Mount Dr
- 1128 Paradise Pkwy
- 1137 Paradise Pkwy
- 1120 Paradise Pkwy
- 1218 W Mount Dr
- 1117 Paradise Pkwy
- 1116 Paradise Pkwy
- 1310 W Mount Dr
- 1141 Paradise Pkwy
- 1127 Magnolia Dr
- 1123 Magnolia Dr
- 1235 W Mount Dr
- 1301 W Mount Dr