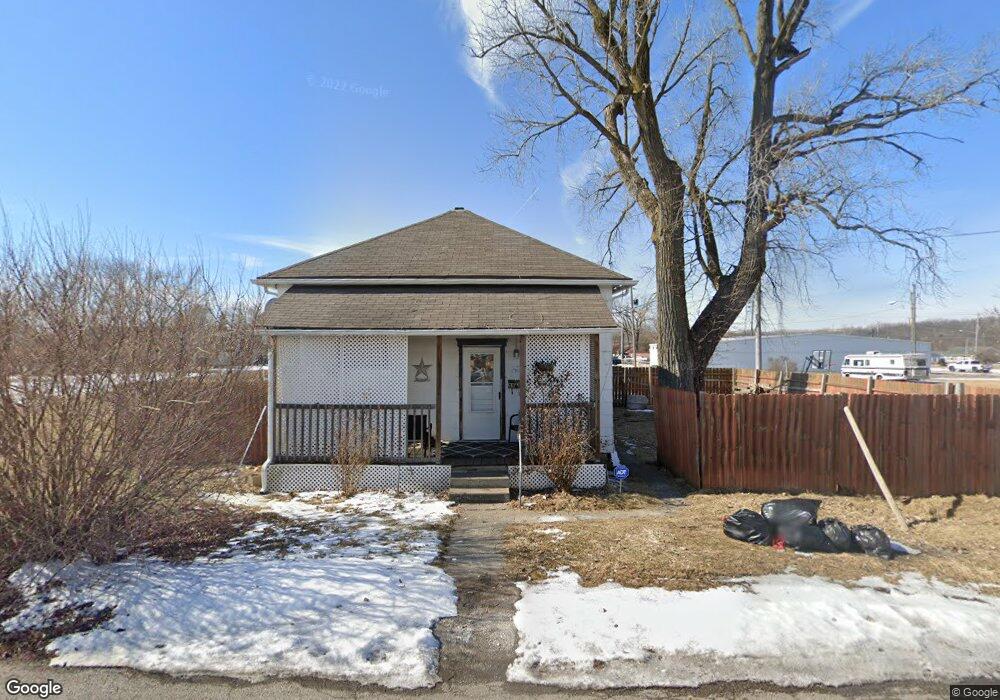
1129 Reaper Ave Springfield, OH 45503
Estimated Value: $68,885 - $135,000
3
Beds
1
Bath
937
Sq Ft
$101/Sq Ft
Est. Value
About This Home
This home is located at 1129 Reaper Ave, Springfield, OH 45503 and is currently estimated at $94,471, approximately $100 per square foot. 1129 Reaper Ave is a home located in Clark County with nearby schools including Warder Park-Wayne Elementary School, Schaefer Middle School, and Springfield High School.
Ownership History
Date
Name
Owned For
Owner Type
Purchase Details
Closed on
Oct 10, 2024
Sold by
Clouse Samuel W
Bought by
Schoneberger Lisa
Current Estimated Value
Purchase Details
Closed on
Dec 21, 2015
Sold by
Mader Bret Eric and Mader Tracy Lynn
Bought by
Clouse Samuel W
Purchase Details
Closed on
Aug 15, 2002
Sold by
Mader Bret Eric and Mader Debra Lynn
Bought by
Miller Danny R
Home Financials for this Owner
Home Financials are based on the most recent Mortgage that was taken out on this home.
Original Mortgage
$30,000
Interest Rate
6.63%
Mortgage Type
Seller Take Back
Purchase Details
Closed on
Oct 13, 1999
Sold by
Haskins June A
Bought by
Mahan Bryan M and Mader Bret E
Home Financials for this Owner
Home Financials are based on the most recent Mortgage that was taken out on this home.
Original Mortgage
$26,400
Interest Rate
7.9%
Mortgage Type
Purchase Money Mortgage
Create a Home Valuation Report for This Property
The Home Valuation Report is an in-depth analysis detailing your home's value as well as a comparison with similar homes in the area
Home Values in the Area
Average Home Value in this Area
Purchase History
| Date | Buyer | Sale Price | Title Company |
|---|---|---|---|
| Schoneberger Lisa | -- | None Listed On Document | |
| Schoneberger Lisa | -- | None Listed On Document | |
| Clouse Samuel W | $15,000 | Attorney | |
| Miller Danny R | $34,000 | -- | |
| Mahan Bryan M | $30,000 | -- |
Source: Public Records
Mortgage History
| Date | Status | Borrower | Loan Amount |
|---|---|---|---|
| Previous Owner | Miller Danny R | $30,000 | |
| Previous Owner | Mahan Bryan M | $26,400 |
Source: Public Records
Tax History
| Year | Tax Paid | Tax Assessment Tax Assessment Total Assessment is a certain percentage of the fair market value that is determined by local assessors to be the total taxable value of land and additions on the property. | Land | Improvement |
|---|---|---|---|---|
| 2025 | $544 | $14,650 | $2,840 | $11,810 |
| 2024 | $1,804 | $10,990 | $2,470 | $8,520 |
| 2023 | $1,167 | $10,990 | $2,470 | $8,520 |
| 2022 | $1,413 | $10,990 | $2,470 | $8,520 |
| 2021 | $491 | $9,180 | $2,030 | $7,150 |
| 2020 | $492 | $9,180 | $2,030 | $7,150 |
| 2019 | $493 | $9,180 | $2,030 | $7,150 |
| 2018 | $445 | $7,960 | $1,800 | $6,160 |
| 2017 | $445 | $7,956 | $1,796 | $6,160 |
| 2016 | $445 | $7,956 | $1,796 | $6,160 |
| 2015 | $724 | $7,956 | $1,796 | $6,160 |
| 2014 | $465 | $7,956 | $1,796 | $6,160 |
| 2013 | $230 | $7,956 | $1,796 | $6,160 |
Source: Public Records
Map
Nearby Homes
- 26-28 N Belmont Ave
- 2023 Cleveland Ave
- 1830 Edwards Ave
- 907 Bellevue Ave
- 2020 Woodside Ave
- 1682 Edwards Ave
- 1710 Mitchell Blvd
- 2201 Woodside Ave
- 1634 Edwards Ave
- 1654 Catawba Ave
- 803 Laurel St
- 1705 Magnolia Blvd
- 2629 Berger Ave
- 1535 Winding Trail
- 1721 Prospect St
- 1223 Lagonda Ave
- 1621 Morgan St
- 2845 Columbus Ave Unit 5
- 107 N Clairmont Ave
- 26 N Belmont Ave
- 1084 N Belmont Ave
- 1070 N Belmont Ave
- 2001 Lagonda Ave
- 2017-2023 Lagonda Ave
- 1066 N Belmont Ave
- 2037 Lagonda Ave
- 1064 N Belmont Ave
- 1106 N Belmont Ave
- 1062 N Belmont Ave
- 1077 N Belmont Ave
- 1071 N Belmont Ave
- 2045 Lagonda Ave
- 1921 Lagonda Ave Unit 1923
- 1063 N Belmont Ave
- 2043 Lagonda Ave
- 1059 N Belmont Ave
- 1913 Lagonda Ave Unit 1915
- 1909 Lagonda Ave
- 1827 N Belmont Ave
- 1928 Lagonda Ave Unit 1930
Your Personal Tour Guide
Ask me questions while you tour the home.