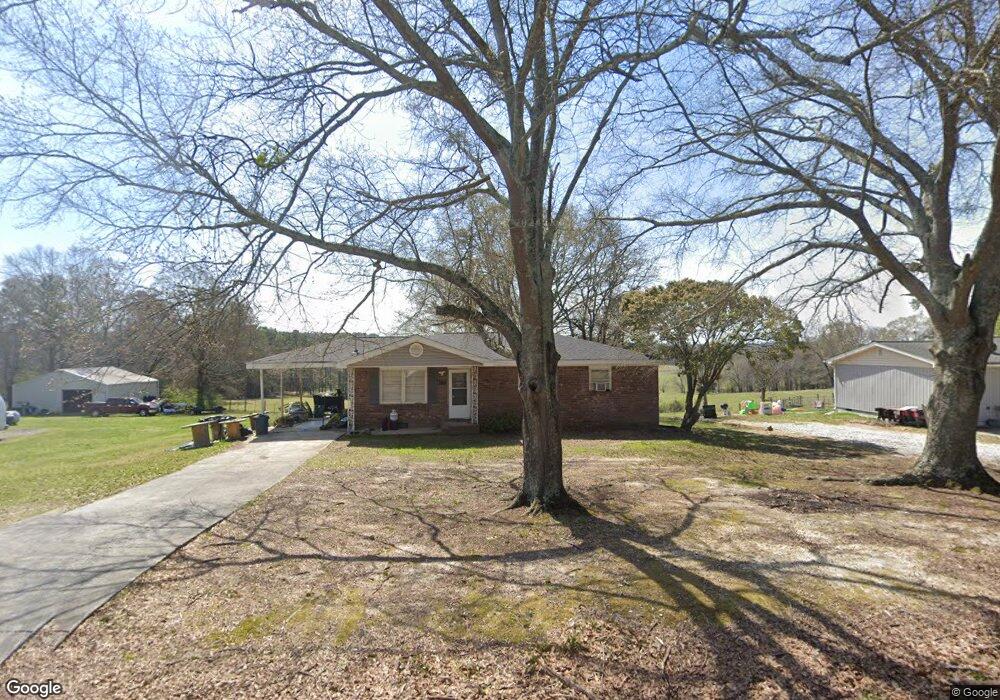
1129 Stringer Rd Rockmart, GA 30153
Estimated Value: $120,000 - $226,000
3
Beds
1
Bath
1,118
Sq Ft
$161/Sq Ft
Est. Value
About This Home
This home is located at 1129 Stringer Rd, Rockmart, GA 30153 and is currently estimated at $179,975, approximately $160 per square foot. 1129 Stringer Rd is a home located in Polk County with nearby schools including Rockmart Middle School.
Ownership History
Date
Name
Owned For
Owner Type
Purchase Details
Closed on
Jan 6, 2026
Sold by
Robinson Laura
Bought by
Dunn Holly and Dunn Morgan
Current Estimated Value
Home Financials for this Owner
Home Financials are based on the most recent Mortgage that was taken out on this home.
Original Mortgage
$101,400
Outstanding Balance
$101,206
Interest Rate
6.22%
Mortgage Type
Purchase Money Mortgage
Estimated Equity
$78,769
Purchase Details
Closed on
Oct 22, 2004
Sold by
Chambers Patricia Gail
Bought by
Robinson Laura L
Purchase Details
Closed on
Mar 31, 2003
Sold by
Peacock Mary
Bought by
Chambers Patricia Gail
Purchase Details
Closed on
Jun 26, 1989
Sold by
Adm Farmers Home Adm
Bought by
Sullivan James B
Purchase Details
Closed on
Jul 8, 1986
Sold by
Duke Thomas and Duke Patsy
Bought by
Farmers Home Admin
Purchase Details
Closed on
Oct 9, 1982
Sold by
Bishop Robert L
Bought by
Duke Thomas and Duke Patsy
Purchase Details
Closed on
Nov 9, 1976
Sold by
Secretary Of H U D
Bought by
Bishop Robert L
Purchase Details
Closed on
Nov 13, 1973
Sold by
Fed Natl Mortgage As
Bought by
Secretary Of H U D
Purchase Details
Closed on
Nov 6, 1973
Sold by
Garrett Milford
Bought by
Fed Natl Mortgage As
Purchase Details
Closed on
Mar 20, 1972
Sold by
Lee J Franklin
Bought by
Garrett Milford
Purchase Details
Closed on
Dec 31, 1970
Bought by
New -Lee Inc
Create a Home Valuation Report for This Property
The Home Valuation Report is an in-depth analysis detailing your home's value as well as a comparison with similar homes in the area
Purchase History
| Date | Buyer | Sale Price | Title Company |
|---|---|---|---|
| Dunn Holly | $105,000 | -- | |
| Robinson Laura L | $63,500 | -- | |
| Chambers Patricia Gail | $30,000 | -- | |
| Sullivan James B | $28,500 | -- | |
| Farmers Home Admin | -- | -- | |
| Duke Thomas | -- | -- | |
| Bishop Robert L | -- | -- | |
| Secretary Of H U D | -- | -- | |
| Fed Natl Mortgage As | -- | -- | |
| Garrett Milford | -- | -- | |
| Lee J Franklin | -- | -- | |
| New -Lee Inc | -- | -- |
Source: Public Records
Mortgage History
| Date | Status | Borrower | Loan Amount |
|---|---|---|---|
| Open | Dunn Holly | $101,400 |
Source: Public Records
Tax History
| Year | Tax Paid | Tax Assessment Tax Assessment Total Assessment is a certain percentage of the fair market value that is determined by local assessors to be the total taxable value of land and additions on the property. | Land | Improvement |
|---|---|---|---|---|
| 2025 | $945 | $41,978 | $3,016 | $38,962 |
| 2024 | $862 | $41,224 | $2,262 | $38,962 |
| 2023 | $675 | $28,424 | $2,262 | $26,162 |
| 2022 | $565 | $23,820 | $1,508 | $22,312 |
| 2021 | $573 | $23,820 | $1,508 | $22,312 |
| 2020 | $574 | $23,820 | $1,508 | $22,312 |
| 2019 | $568 | $21,158 | $1,508 | $19,650 |
| 2018 | $566 | $20,541 | $1,508 | $19,033 |
| 2017 | $563 | $20,682 | $1,649 | $19,033 |
| 2016 | $543 | $19,953 | $920 | $19,033 |
| 2015 | $538 | $19,712 | $920 | $18,792 |
| 2014 | $542 | $19,712 | $920 | $18,792 |
Source: Public Records
Map
Nearby Homes
- 907 Stringer Rd
- 957 Bethlehem Rd
- 93 Clay Rd
- 0 Bethlehem Rd Unit 7730467
- 0 Bethlehem Rd Unit 10705308
- 397 Stringer Rd
- 461 Lakeview Rd
- 65 Wheeler Rd
- 3566 Rockmart Hwy
- 184 Morgan Ln
- Lot 10 Sunset Loop
- 18 Hillside Dr
- 2056 Bellview Rd
- 341 Sunset Loop
- 0 Pine Mountain Rd Unit 7662185
- 600 Grady Rd
- 536 Wimberly Hill Rd
- 0 Tolbert Town Rd Unit 10640593
- 0 Tolbert Town Rd Unit 7678739
- 2512 Tolbert Town Rd
- 1137 Stringer Rd
- 1117 Stringer Rd
- 1147 Stringer Rd
- 1167 Stringer Rd
- 1049 Stringer Rd
- 1177 Stringer Rd
- 1196 Stringer Rd
- 1038 Stringer Rd
- 1210 Stringer Rd
- 1301 Stringer Rd
- 1212 Stringer Rd
- 1232 Stringer Rd
- 608 Zuker Rd
- 1234 Stringer Rd
- 1098 Stringer Rd
- 1276 Stringer Rd
- 0K Zuker Rd
- 0J Zuker Rd
- 0I Zuker Rd
- 0H Zuker Rd
Your Personal Tour Guide
Ask me questions while you tour the home.