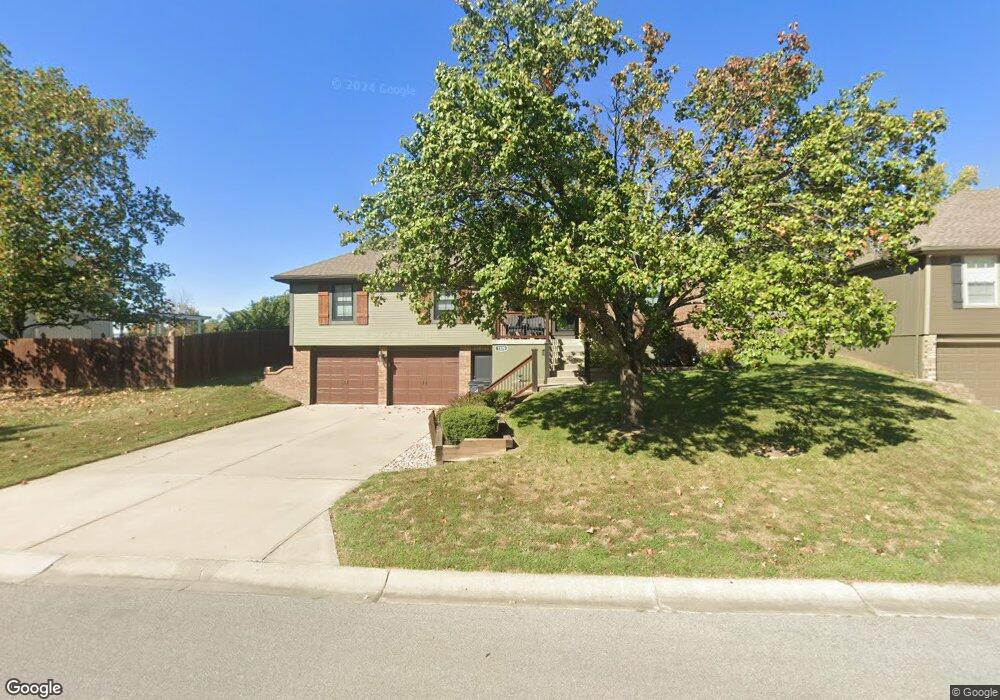
1129 SW Hillcrest Dr Blue Springs, MO 64015
Estimated Value: $314,920 - $372,000
3
Beds
3
Baths
1,613
Sq Ft
$208/Sq Ft
Est. Value
About This Home
This home is located at 1129 SW Hillcrest Dr, Blue Springs, MO 64015 and is currently estimated at $336,230, approximately $208 per square foot. 1129 SW Hillcrest Dr is a home located in Jackson County with nearby schools including Cordill-Mason Elementary School, Moreland Ridge Middle School, and Blue Springs South High School.
Ownership History
Date
Name
Owned For
Owner Type
Purchase Details
Closed on
May 20, 2016
Sold by
Shaw Lajaunie Properties Llc
Bought by
Shaw John Calvin
Current Estimated Value
Home Financials for this Owner
Home Financials are based on the most recent Mortgage that was taken out on this home.
Original Mortgage
$130,000
Outstanding Balance
$103,252
Interest Rate
3.59%
Mortgage Type
New Conventional
Estimated Equity
$232,978
Purchase Details
Closed on
Sep 18, 2013
Sold by
Richard James C and Richard Jenessa L
Bought by
Heartland Property Group Inc
Purchase Details
Closed on
Sep 19, 2006
Sold by
Massey Kevin D and Massey Kimberly S
Bought by
Richard James C and Richard Jenessa L
Home Financials for this Owner
Home Financials are based on the most recent Mortgage that was taken out on this home.
Original Mortgage
$163,706
Interest Rate
6.55%
Mortgage Type
FHA
Purchase Details
Closed on
Jan 12, 1996
Sold by
Mountaine Robin
Bought by
Massey Kevin D and Massey Kimberly S
Home Financials for this Owner
Home Financials are based on the most recent Mortgage that was taken out on this home.
Original Mortgage
$92,025
Interest Rate
7.31%
Mortgage Type
FHA
Create a Home Valuation Report for This Property
The Home Valuation Report is an in-depth analysis detailing your home's value as well as a comparison with similar homes in the area
Home Values in the Area
Average Home Value in this Area
Purchase History
| Date | Buyer | Sale Price | Title Company |
|---|---|---|---|
| Shaw John Calvin | -- | Stewart Title Company | |
| Heartland Property Group Inc | $92,300 | None Available | |
| Richard James C | -- | First American Title Co | |
| Massey Kevin D | -- | -- |
Source: Public Records
Mortgage History
| Date | Status | Borrower | Loan Amount |
|---|---|---|---|
| Open | Shaw John Calvin | $130,000 | |
| Previous Owner | Richard James C | $163,706 | |
| Previous Owner | Massey Kevin D | $92,025 |
Source: Public Records
Tax History Compared to Growth
Tax History
| Year | Tax Paid | Tax Assessment Tax Assessment Total Assessment is a certain percentage of the fair market value that is determined by local assessors to be the total taxable value of land and additions on the property. | Land | Improvement |
|---|---|---|---|---|
| 2025 | $3,504 | $50,256 | $6,888 | $43,368 |
| 2024 | $3,434 | $43,865 | $4,632 | $39,233 |
| 2023 | $3,434 | $43,865 | $4,896 | $38,969 |
| 2022 | $3,382 | $38,000 | $4,484 | $33,516 |
| 2021 | $3,185 | $38,000 | $4,484 | $33,516 |
| 2020 | $3,018 | $34,565 | $4,484 | $30,081 |
| 2019 | $2,932 | $34,565 | $4,484 | $30,081 |
| 2018 | $2,809 | $32,047 | $4,373 | $27,674 |
| 2017 | $2,728 | $32,047 | $4,373 | $27,674 |
| 2016 | $2,728 | $31,236 | $4,693 | $26,543 |
| 2014 | $2,737 | $31,042 | $4,680 | $26,362 |
Source: Public Records
Map
Nearby Homes
- 1205 SW Southgate Dr
- 4716 SW 6th Terrace
- 4712 SW 6th Terrace
- 4000 SW 9th St
- 3908 SW 9th St
- 505 SW Newport Dr
- 509 SW Newport Dr
- 500 SW Chelmsford Dr
- 305 SW Nelson Dr
- 217 SW Chelmsford Dr
- 3608 SW 10th Street Ct
- 220 SW Chelmsford Dr
- 3605 SW Meyer Blvd
- Brookside Plan at Eagles Ridge - Premier Collection
- Serenity Plan at Eagles Ridge - Bliss Collection
- Starlight Plan at Eagles Ridge
- Serenade Plan at Eagles Ridge - Bliss Collection
- Devotion Plan at Eagles Ridge - Bliss Collection
- Avalon Plan at Eagles Ridge - Premier Collection
- The Gardenia Plan at Eagles Ridge - Garden Collection
- 1136 SW Southgate Dr
- 4508 SW 12th St
- 1121 SW Hillcrest Dr
- 1132 SW Southgate Dr
- 1132 SW Hillcrest Dr
- 1128 SW Hillcrest Dr
- 1136 SW Hillcrest Dr
- 1124 SW Hillcrest Dr
- 1128 SW Southgate Dr
- 1117 SW Hillcrest Dr
- 1124 SW Southgate Dr
- 1120 SW Hillcrest Dr
- 1203 SW Hillcrest Dr
- 1133 SW Southgate Dr
- 1129 SW Southgate Dr
- 1113 SW Hillcrest Dr
- 4504 SW 12th St
- 1116 SW Hillcrest Dr
- 4603 SW 11th Street Ct
- 4602 SW 11th Street Ct