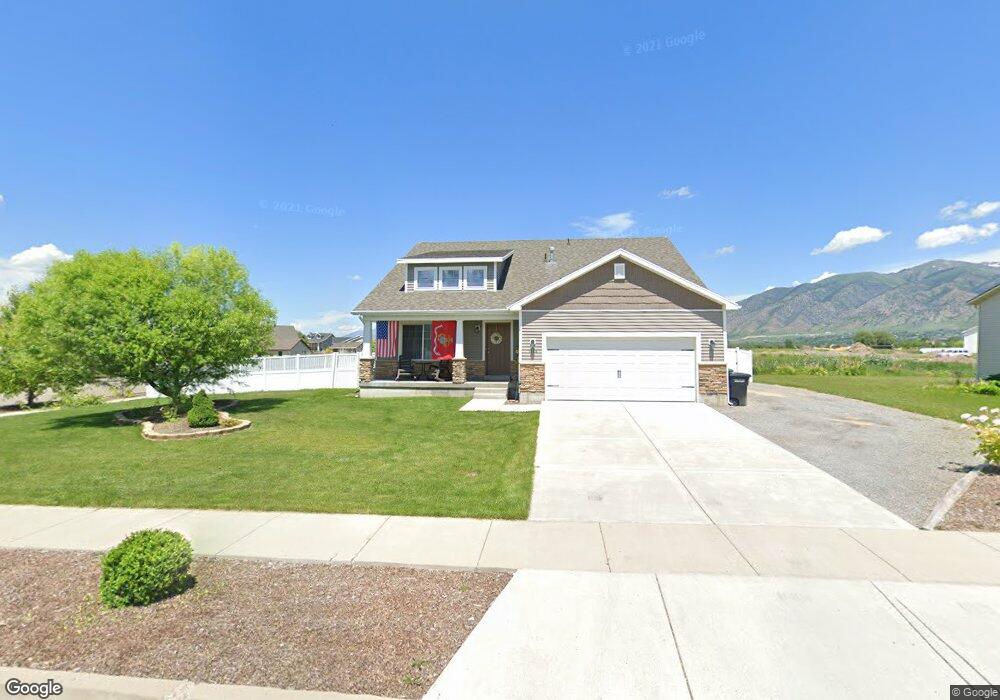
1129 W 2450 S Unit 47 Nibley, UT 84321
Estimated Value: $468,000 - $559,707
--
Bed
--
Bath
1,459
Sq Ft
$349/Sq Ft
Est. Value
About This Home
This home is located at 1129 W 2450 S Unit 47, Nibley, UT 84321 and is currently estimated at $508,927, approximately $348 per square foot. 1129 W 2450 S Unit 47 is a home located in Cache County with nearby schools including Nibley School, Spring Creek Middle School, and South Cache Middle School.
Ownership History
Date
Name
Owned For
Owner Type
Purchase Details
Closed on
Jun 29, 2016
Sold by
Tagg J Burton and Tagg Annette E
Bought by
Hammond Maxim Edzell and Hammond Marnie T
Current Estimated Value
Home Financials for this Owner
Home Financials are based on the most recent Mortgage that was taken out on this home.
Original Mortgage
$264,000
Outstanding Balance
$210,752
Interest Rate
3.58%
Mortgage Type
VA
Estimated Equity
$298,175
Purchase Details
Closed on
Jun 19, 2015
Sold by
Orme Daren B and Orme Rachel
Bought by
The Tagg Living Trust
Purchase Details
Closed on
Jan 12, 2012
Sold by
Kartchner Homes Cv Division Inc
Bought by
Orme Daren B and Orme Rachel
Purchase Details
Closed on
Sep 13, 2011
Sold by
Lewiston State Bank
Bought by
Kartchner Homes Cv Division Inc
Home Financials for this Owner
Home Financials are based on the most recent Mortgage that was taken out on this home.
Original Mortgage
$144,000
Interest Rate
4.37%
Mortgage Type
Seller Take Back
Purchase Details
Closed on
Feb 23, 2010
Sold by
Compass Point Development Inc
Bought by
Lewiston State Bank
Create a Home Valuation Report for This Property
The Home Valuation Report is an in-depth analysis detailing your home's value as well as a comparison with similar homes in the area
Home Values in the Area
Average Home Value in this Area
Purchase History
| Date | Buyer | Sale Price | Title Company |
|---|---|---|---|
| Hammond Maxim Edzell | -- | Hickland Title Company | |
| The Tagg Living Trust | -- | Heritage West Title | |
| Orme Daren B | -- | Cache Title Company | |
| Kartchner Homes Cv Division Inc | -- | Cache Title Company | |
| Lewiston State Bank | -- | Hickman Land Title Company |
Source: Public Records
Mortgage History
| Date | Status | Borrower | Loan Amount |
|---|---|---|---|
| Open | Hammond Maxim Edzell | $264,000 | |
| Previous Owner | Kartchner Homes Cv Division Inc | $144,000 |
Source: Public Records
Tax History Compared to Growth
Tax History
| Year | Tax Paid | Tax Assessment Tax Assessment Total Assessment is a certain percentage of the fair market value that is determined by local assessors to be the total taxable value of land and additions on the property. | Land | Improvement |
|---|---|---|---|---|
| 2024 | $2,480 | $308,655 | $0 | $0 |
| 2023 | $2,628 | $306,240 | $0 | $0 |
| 2022 | $2,735 | $306,240 | $0 | $0 |
| 2021 | $2,058 | $357,767 | $69,300 | $288,467 |
| 2020 | $1,934 | $320,141 | $69,300 | $250,841 |
| 2019 | $2,029 | $320,140 | $69,300 | $250,840 |
| 2018 | $1,786 | $274,965 | $51,000 | $223,965 |
| 2017 | $1,782 | $145,365 | $0 | $0 |
| 2016 | $1,802 | $102,190 | $0 | $0 |
| 2015 | $1,225 | $99,440 | $0 | $0 |
| 2014 | $1,197 | $99,440 | $0 | $0 |
| 2013 | -- | $99,330 | $0 | $0 |
Source: Public Records
Map
Nearby Homes
- 1045 W 2400 S
- 2237 S 1150 W Unit 39
- 2205 S 1120 W Unit 62
- 2203 S 1150 W Unit 43
- 2544 S 1100 W
- 2313 S 1000 W Unit 110
- 2485 S 1296 W
- Briarwood Plan at Firefly Estates
- Phoenix Plan at Firefly Estates
- Hailey Plan at Firefly Estates
- Stansbury Plan at Firefly Estates
- Monroe Plan at Firefly Estates
- Chateau Plan at Firefly Estates
- Alpine Plan at Firefly Estates
- Gala Plan at Firefly Estates
- McIntosh Plan at Firefly Estates
- Madison Plan at Firefly Estates
- 1065 W 2740 S
- 2174 S 1450 W
- 2662 S 850 W
- 1129 W 2450 S
- 855 S Meadow Ln Unit 71
- 903 S Meadow Ln
- 1121 W 2450 S
- 1121 Nibley Park Ave Unit 46
- 418 W 3025 S
- 2258 S 1180 W Unit 33
- 2238 S 1180 W Unit 28
- 417 W 3025 S Unit 315
- 2251 S 1180 W Unit 14
- 1080 W 2400 S
- 1104 Nibley Park Ave Unit 51
- 1137 W 2400 S
- 1128 W 2450 S
- 1081 W 2350 S
- 1081 W 2350 S Unit 33
- 1113 W 2450 S
- 1072 W 2400 S
- 1072 W 2400 S Unit 35
- 1120 Nibley Park Ave Unit 49