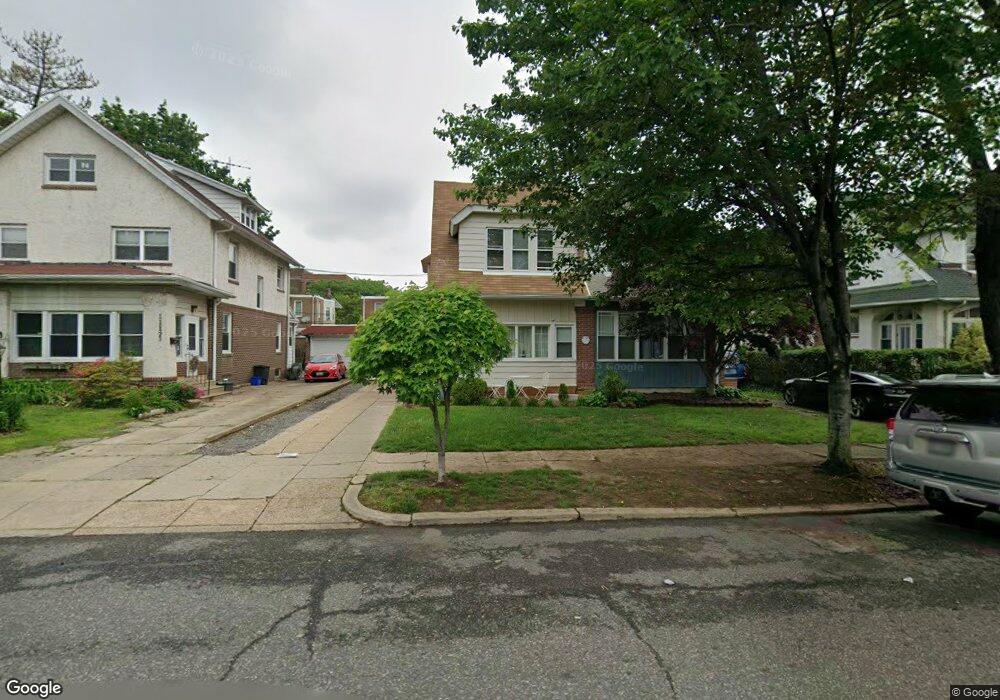
1129 Wakeling St Philadelphia, PA 19124
Frankford NeighborhoodEstimated Value: $257,000 - $334,000
4
Beds
2
Baths
1,280
Sq Ft
$219/Sq Ft
Est. Value
About This Home
This home is located at 1129 Wakeling St, Philadelphia, PA 19124 and is currently estimated at $279,810, approximately $218 per square foot. 1129 Wakeling St is a home located in Philadelphia County with nearby schools including Frankford High School, The Philadelphia Charter School for the Arts & Sciences, and Northwood Academy Charter School.
Ownership History
Date
Name
Owned For
Owner Type
Purchase Details
Closed on
Sep 19, 2008
Sold by
Odonnell Howe and Odonnell Cynthia
Bought by
Abraham Karen
Current Estimated Value
Home Financials for this Owner
Home Financials are based on the most recent Mortgage that was taken out on this home.
Original Mortgage
$196,311
Outstanding Balance
$130,353
Interest Rate
6.57%
Mortgage Type
FHA
Estimated Equity
$149,457
Purchase Details
Closed on
Oct 4, 2005
Sold by
Odonnell Howe
Bought by
Odonnell Howe and Odonnell Cynthia
Home Financials for this Owner
Home Financials are based on the most recent Mortgage that was taken out on this home.
Original Mortgage
$156,000
Interest Rate
5.85%
Mortgage Type
New Conventional
Purchase Details
Closed on
Jun 26, 1998
Sold by
Atlantic Mtg
Bought by
Odonnell Howe
Purchase Details
Closed on
Jul 28, 1997
Sold by
Fidelity Bond & Mtg Company
Bought by
Federal National Mortgage Association
Create a Home Valuation Report for This Property
The Home Valuation Report is an in-depth analysis detailing your home's value as well as a comparison with similar homes in the area
Home Values in the Area
Average Home Value in this Area
Purchase History
| Date | Buyer | Sale Price | Title Company |
|---|---|---|---|
| Abraham Karen | $214,900 | None Available | |
| Odonnell Howe | -- | None Available | |
| Odonnell Howe | $66,400 | -- | |
| Atlantic Mtg | $66,400 | -- | |
| Federal National Mortgage Association | $6,200 | -- |
Source: Public Records
Mortgage History
| Date | Status | Borrower | Loan Amount |
|---|---|---|---|
| Open | Abraham Karen | $196,311 | |
| Previous Owner | Odonnell Howe | $156,000 |
Source: Public Records
Tax History Compared to Growth
Tax History
| Year | Tax Paid | Tax Assessment Tax Assessment Total Assessment is a certain percentage of the fair market value that is determined by local assessors to be the total taxable value of land and additions on the property. | Land | Improvement |
|---|---|---|---|---|
| 2026 | $2,921 | $241,200 | $48,200 | $193,000 |
| 2025 | $2,921 | $241,200 | $48,200 | $193,000 |
| 2024 | $2,921 | $241,200 | $48,200 | $193,000 |
| 2023 | $2,921 | $208,700 | $41,740 | $166,960 |
| 2022 | $1,524 | $163,700 | $41,740 | $121,960 |
| 2021 | $2,154 | $0 | $0 | $0 |
| 2020 | $2,154 | $0 | $0 | $0 |
| 2019 | $2,068 | $0 | $0 | $0 |
| 2018 | $2,047 | $0 | $0 | $0 |
| 2017 | $2,047 | $0 | $0 | $0 |
| 2016 | $1,627 | $0 | $0 | $0 |
| 2015 | $1,557 | $0 | $0 | $0 |
| 2014 | -- | $146,200 | $47,938 | $98,262 |
| 2012 | -- | $17,568 | $2,722 | $14,846 |
Source: Public Records
Map
Nearby Homes
- 1208 Haworth St
- 1214 Haworth St
- 5118 Oakland St
- 1204 Pratt St
- 1218 Pratt St
- 1220 Pratt St
- 1052 Allengrove St
- 5033 Akron St
- 1300 Harrison St
- 1359 Dyre St
- 1335 Fillmore St
- 1859 Harrison St
- 1137 Bridge St
- 5241 Akron St
- 1048 Bridge St
- 5244 Saul St
- 4941 Penn St
- 4717 Northwood St
- 4925 Penn St
- 5304 Akron St
- 1135 Wakeling St
- 1127 Wakeling St
- 1137 Wakeling St
- 1117 Wakeling St
- 1124 Haworth St
- 1126 Haworth St
- 1122 Haworth St
- 1139 Wakeling St Unit 41
- 1128 Haworth St
- 1120 Haworth St
- 1130 Haworth St
- 1118 Haworth St
- 1111 Wakeling St
- 1116 Haworth St
- 1134 Haworth St
- 1114 Haworth St
- 1151 Wakeling St
- 1126 Wakeling St
- 1122 Wakeling St
- 1128 Wakeling St