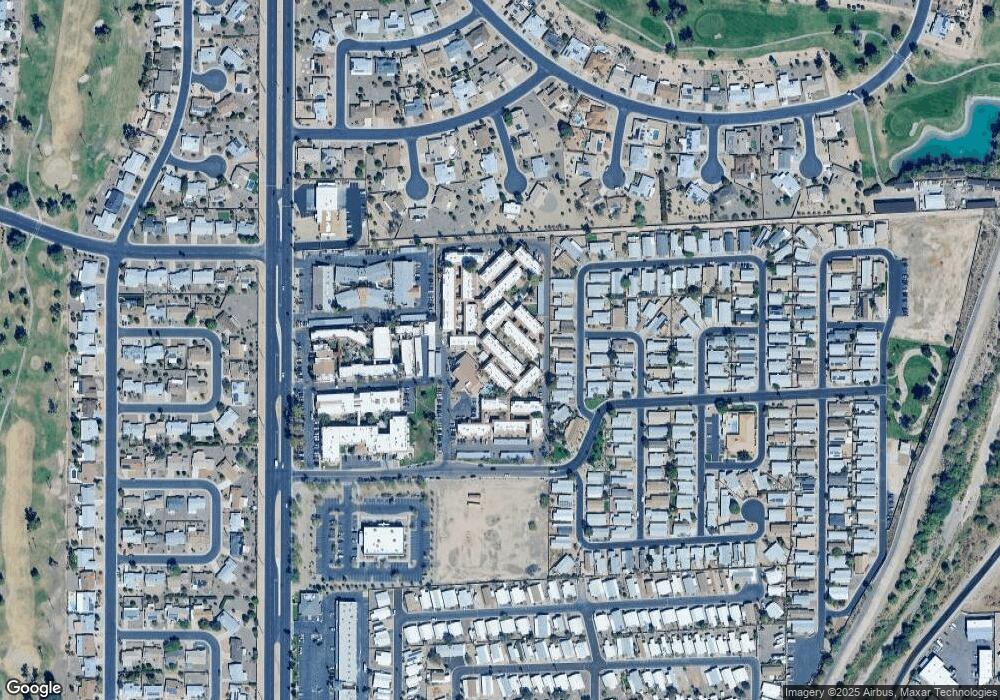
11295 N 99th Ave Peoria, AZ 85345
About This Home
The Gardens floor plans at Immanuel's Campus of Care are perfect for our aging adults. These structures are thoughtfully crafted to ensure residents and staff can move around effortlessly. Whether you are on the garden level or take the cozy staircase or elevator up to the second floor, our two-story independent living community is built with both practicality and aesthetics.
The Gardens is designed for residents wishing to retain maximum independence while enjoying all the amenities offered at Immanuel Campus of Care. Residents can choose between one or two-bedroom apartments, and we’re sure you’ll find a space that’s just right to call your own.
Our independent living apartments welcome Section 8 Housing and offer some of the most budget-friendly housing in the West Valley and through Maricopa County. We strive to help seniors throughout the greater Phoenix area enjoy their golden years by providing excellent amenities, engaging activities, and a sense of community. Please contact us to tour our beautiful desert living community today!
We are dedicated to providing the highest standards in our care to guests, interactions with our associates, and in our efforts to raise the quality of life for all. We are committed to our belief in services with integrity for our guest, their families, our associates, and our business associates.
Home Values in the Area
Average Home Value in this Area
Property History
| Date | Event | Price | List to Sale | Price per Sq Ft |
|---|---|---|---|---|
| 07/04/2025 07/04/25 | Off Market | $1,128 | -- | -- |
| 06/10/2024 06/10/24 | Price Changed | $1,128 | -8.1% | $2 / Sq Ft |
| 05/29/2024 05/29/24 | Price Changed | $1,228 | +8.9% | $2 / Sq Ft |
| 05/25/2024 05/25/24 | For Rent | $1,128 | -- | -- |
Tax History Compared to Growth
Tax History
| Year | Tax Paid | Tax Assessment Tax Assessment Total Assessment is a certain percentage of the fair market value that is determined by local assessors to be the total taxable value of land and additions on the property. | Land | Improvement |
|---|---|---|---|---|
| 2025 | -- | $1,448,538 | -- | -- |
| 2024 | -- | $1,379,560 | -- | -- |
| 2023 | $0 | $1,648,995 | $174,750 | $1,474,245 |
| 2022 | $0 | $1,454,985 | $139,635 | $1,315,350 |
| 2021 | $0 | $1,478,565 | $139,635 | $1,338,930 |
| 2020 | $0 | $1,481,880 | $104,910 | $1,376,970 |
| 2019 | $133,132 | $1,454,055 | $94,515 | $1,359,540 |
| 2018 | $0 | $1,011,910 | $63,750 | $948,160 |
| 2017 | $0 | $958,050 | $61,300 | $896,750 |
| 2016 | $84,352 | $1,003,848 | $53,780 | $950,068 |
| 2015 | -- | $623,280 | $44,870 | $578,410 |
Map
- 9831 W Pebble Beach Dr
- 11275 N 99th Ave Unit 9
- 11275 N 99th Ave Unit 10
- 11275 N 99th Ave Unit 219
- 11275 N 99th Ave Unit 65
- 9915 W Hope Cir S
- 10701 N 99th Ave Unit 22
- 10701 N 99th Ave Unit 159
- 10701 N 99th Ave Unit 135
- 10701 N 99th Ave Unit 17
- 10701 N 99th Ave Unit 33
- 10701 N 99th Ave Unit 235
- 10701 N 99th Ave Unit OFC
- 10701 N 99th Ave Unit 136
- 11442 N Coggins Dr
- 11054 N Coggins Dr
- 11614 N Hagen Dr
- 10013 W Lakeview Cir N
- 10219 W Snead Cir S
- 10222 W Snead Cir S
- 11403 N 98th Dr
- 11407 N 98th Dr
- 11402 N 98th Ave
- 11406 N 98th Ave
- 11402 N 98th Dr
- 11275 N 99 #029 Ave Unit 29
- 11411 N 98th Dr
- 11403 N 98th Ave Unit 10
- 11410 N 98th Ave
- 11406 N 98th Dr
- 11275 N 99 #045 Ave Unit 45
- 11275 N 99 #047 Ave Unit 47
- 11415 N 98th Dr
- 11407 N 98th Ave
- 11402 N Floral Ct Unit 10
- 11410 N 98th Dr
- 11414 N 98th Ave
- 9827 W Pebble Beach Dr
- 11411 N 98th Ave
- 11403 N Floral Ct
