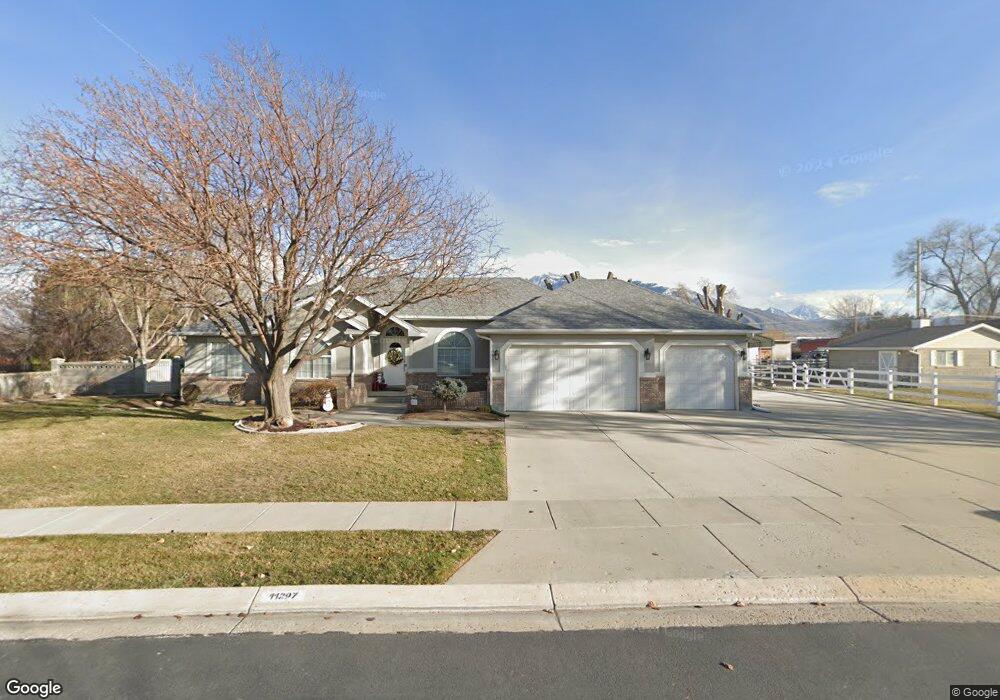
11297 S 675 W South Jordan, UT 84095
Estimated Value: $663,000 - $832,281
3
Beds
3
Baths
1,570
Sq Ft
$476/Sq Ft
Est. Value
About This Home
This home is located at 11297 S 675 W, South Jordan, UT 84095 and is currently estimated at $747,070, approximately $475 per square foot. 11297 S 675 W is a home located in Salt Lake County with nearby schools including South Jordan School, South Jordan Middle School, and Hawthorn Academy South Jordan.
Ownership History
Date
Name
Owned For
Owner Type
Purchase Details
Closed on
Dec 1, 2004
Sold by
Savage Richard L
Bought by
Savage Shana L
Current Estimated Value
Purchase Details
Closed on
Jul 15, 1994
Sold by
Kent Nickell Construction
Bought by
Savage Richard L and Savage Shana L
Home Financials for this Owner
Home Financials are based on the most recent Mortgage that was taken out on this home.
Original Mortgage
$105,100
Interest Rate
8.57%
Purchase Details
Closed on
Mar 23, 1994
Sold by
K S Land Associates
Bought by
Kent Nickell Construction Inc
Home Financials for this Owner
Home Financials are based on the most recent Mortgage that was taken out on this home.
Original Mortgage
$118,000
Interest Rate
7.15%
Create a Home Valuation Report for This Property
The Home Valuation Report is an in-depth analysis detailing your home's value as well as a comparison with similar homes in the area
Home Values in the Area
Average Home Value in this Area
Purchase History
| Date | Buyer | Sale Price | Title Company |
|---|---|---|---|
| Savage Shana L | -- | Backman Stewart Title Svcs | |
| Savage Richard L | -- | -- | |
| Kent Nickell Construction Inc | -- | -- |
Source: Public Records
Mortgage History
| Date | Status | Borrower | Loan Amount |
|---|---|---|---|
| Closed | Savage Richard L | $105,100 | |
| Previous Owner | Kent Nickell Construction Inc | $118,000 |
Source: Public Records
Tax History Compared to Growth
Tax History
| Year | Tax Paid | Tax Assessment Tax Assessment Total Assessment is a certain percentage of the fair market value that is determined by local assessors to be the total taxable value of land and additions on the property. | Land | Improvement |
|---|---|---|---|---|
| 2025 | $4,005 | $784,900 | $449,100 | $335,800 |
| 2024 | $4,005 | $758,600 | $306,500 | $452,100 |
| 2023 | $3,717 | $664,400 | $289,100 | $375,300 |
| 2022 | $3,961 | $693,800 | $283,400 | $410,400 |
| 2021 | $3,445 | $553,500 | $253,900 | $299,600 |
| 2020 | $3,183 | $479,500 | $206,700 | $272,800 |
| 2019 | $3,177 | $470,300 | $154,700 | $315,600 |
| 2018 | $3,018 | $444,600 | $154,700 | $289,900 |
| 2017 | $2,736 | $395,000 | $154,700 | $240,300 |
| 2016 | $2,701 | $369,400 | $154,700 | $214,700 |
| 2015 | $2,826 | $375,700 | $172,900 | $202,800 |
| 2014 | $2,713 | $354,500 | $164,400 | $190,100 |
Source: Public Records
Map
Nearby Homes
- 11324 S Trent Dr
- 11187 S Devon View Dr
- 724 W Maple Drift Ln
- 11534 Sweet Grass Ct
- Sonderborg Plan at Big Willow Creek - Collection & Cottage
- Lillehammer Plan at Big Willow Creek - Collection & Cottage
- Nyborg Plan at Big Willow Creek - Collection & Cottage
- Raleigh Traditional Plan at Big Willow Creek
- 498 W Maidengrass Way
- 504 W Maidengrass Way
- 11552 S Sweet Grass Ct
- 702 W Osborne Fox Way
- 11173 S Aspen Peak Dr
- Bentley II Plan at Fox Landing
- Crescent Plan at Fox Landing
- Hensley Plan at Fox Landing
- Bayhill Plan at Fox Landing
- Rosamund Plan at Fox Landing
- Midway Plan at Fox Landing
- Stonehaven Plan at Fox Landing
- 11323 S 675 W
- 11277 S 675 W
- 11328 S Brook N Lance
- 11308 S 675 W
- 11330 Brook N Lance
- 11286 S 675 W
- 11320 Brook N Lance
- 11368 S Brook N Lance
- 11368 S Brook N Lance
- 11368 S Brook N Lance
- 11272 S 675 W
- 11273 S 675 W
- 11341 S 675 W
- 11334 S 675 W
- 11218 S Gracie View Ln
- 11294 Brook N Lance
- 11294 S Brook N Lance
- 11374 Brook N Lance
- 11307 Trent Dr
- 11291 Trent Dr