112A Pond Way Unit 112A Staten Island, NY 10303
Mariners Harbor NeighborhoodEstimated Value: $241,232 - $318,000
--
Bed
--
Bath
730
Sq Ft
$402/Sq Ft
Est. Value
About This Home
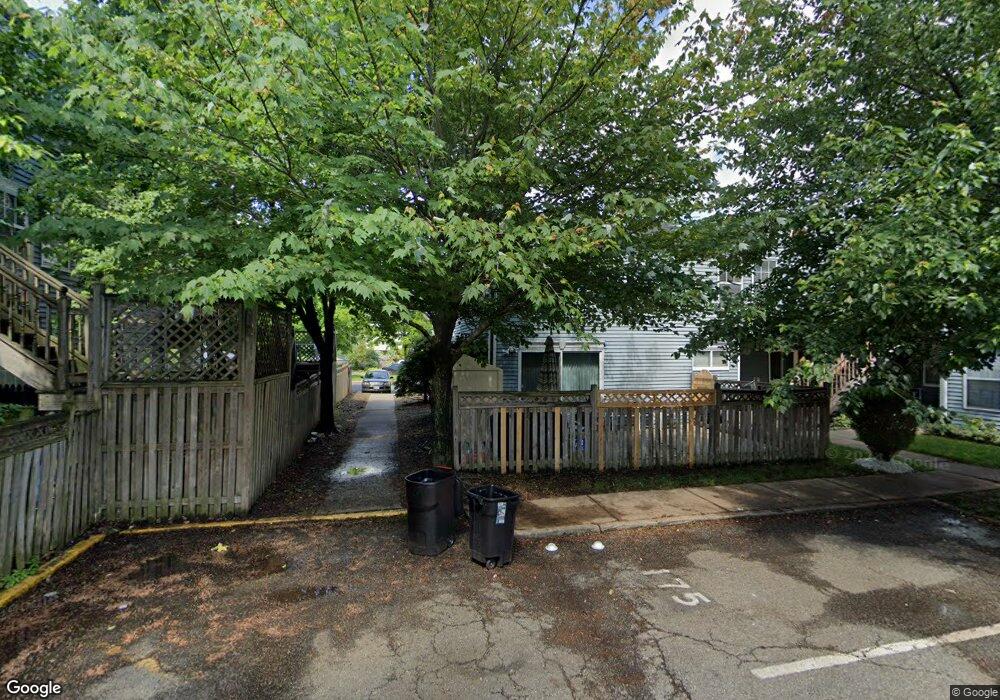
This home is located at 112A Pond Way Unit 112A, Staten Island, NY 10303 and is currently estimated at $293,308, approximately $401 per square foot. 112A Pond Way Unit 112A is a home located in Richmond County with nearby schools including P.S. 44 Thomas C Brown, I.S. 51 Edwin Markham, and Port Richmond High School.
Ownership History
Date
Name
Owned For
Owner Type
Purchase Details
Closed on
Oct 5, 2007
Sold by
Kerman Jeffrey
Bought by
Vera Jamel
Current Estimated Value
Home Financials for this Owner
Home Financials are based on the most recent Mortgage that was taken out on this home.
Original Mortgage
$176,125
Outstanding Balance
$110,987
Interest Rate
6.39%
Mortgage Type
Unknown
Estimated Equity
$182,321
Purchase Details
Closed on
Oct 23, 2003
Sold by
Dixon Carl
Bought by
Kerman Jeffrey
Home Financials for this Owner
Home Financials are based on the most recent Mortgage that was taken out on this home.
Original Mortgage
$148,866
Interest Rate
6.01%
Mortgage Type
Unknown
Purchase Details
Closed on
Oct 6, 1998
Sold by
Nyc Prtnrshp Hsng Development Fund Co In
Bought by
Dixon Carl
Home Financials for this Owner
Home Financials are based on the most recent Mortgage that was taken out on this home.
Original Mortgage
$18,094
Interest Rate
6.49%
Create a Home Valuation Report for This Property
The Home Valuation Report is an in-depth analysis detailing your home's value as well as a comparison with similar homes in the area
Home Values in the Area
Average Home Value in this Area
Purchase History
| Date | Buyer | Sale Price | Title Company |
|---|---|---|---|
| Vera Jamel | $185,400 | None Available | |
| Kerman Jeffrey | $153,470 | -- | |
| Dixon Carl | $68,000 | -- |
Source: Public Records
Mortgage History
| Date | Status | Borrower | Loan Amount |
|---|---|---|---|
| Open | Vera Jamel | $176,125 | |
| Previous Owner | Kerman Jeffrey | $148,866 | |
| Previous Owner | Dixon Carl | $18,094 |
Source: Public Records
Tax History Compared to Growth
Tax History
| Year | Tax Paid | Tax Assessment Tax Assessment Total Assessment is a certain percentage of the fair market value that is determined by local assessors to be the total taxable value of land and additions on the property. | Land | Improvement |
|---|---|---|---|---|
| 2025 | $2,425 | $17,660 | $1,444 | $16,216 |
| 2024 | $2,425 | $14,450 | $1,664 | $12,786 |
| 2023 | $2,313 | $11,391 | $1,685 | $9,706 |
| 2022 | $2,145 | $10,746 | $1,992 | $8,754 |
| 2021 | $2,261 | $10,746 | $1,992 | $8,754 |
| 2020 | $2,297 | $12,406 | $1,992 | $10,414 |
| 2019 | $2,253 | $13,053 | $1,992 | $11,061 |
| 2018 | $2,071 | $10,160 | $1,935 | $8,225 |
| 2017 | $1,954 | $9,585 | $1,979 | $7,606 |
| 2016 | $1,808 | $9,044 | $1,919 | $7,125 |
| 2015 | $1,722 | $9,044 | $1,634 | $7,410 |
| 2014 | $1,722 | $8,974 | $1,460 | $7,514 |
Source: Public Records
Map
Nearby Homes
- 189 Pond Way Unit A
- 176 Arlington Place
- 221 South Ave
- 136 Holland Ave
- 134 South Ave
- 25 Benjamin Place
- 312 Grandview Ave
- 137 South Ave
- 96 Northfield Ave
- 113 Grandview Ave
- 342 Union Avenue #P7
- 58 Grandview Ave
- 402 Grandview Ave
- 53 South Ave
- 51 Mersereau Ave
- 17 Federal Place
- 17 Holland Ave
- 34 Andros Ave
- 16 Mersereau Ave
- 44 Betty Ct
- 112B Pond Way Unit 112B
- 112 Pond Way
- 112 Pond Way Unit B
- 112 Pond Way Unit A
- 110 Pond Way Unit B
- 110A Pond Way Unit 110A
- 110B Pond Way Unit 110B
- 114 Pond Way Unit 114
- 116 Pond Way Unit 116
- 108 Pond Way Unit B
- 108A Pond Way Unit 108A
- 108B Pond Way Unit 108B
- 108 Pond Way Unit A
- 106 Pond Way Unit 106
- 120 Pond Way Unit 120
- 118 Pond Way Unit 118
- 104 Pond Way Unit 104
- 102 Pond Way Unit 102
- 100 Pond Way Unit 100
- 107 Pond Way