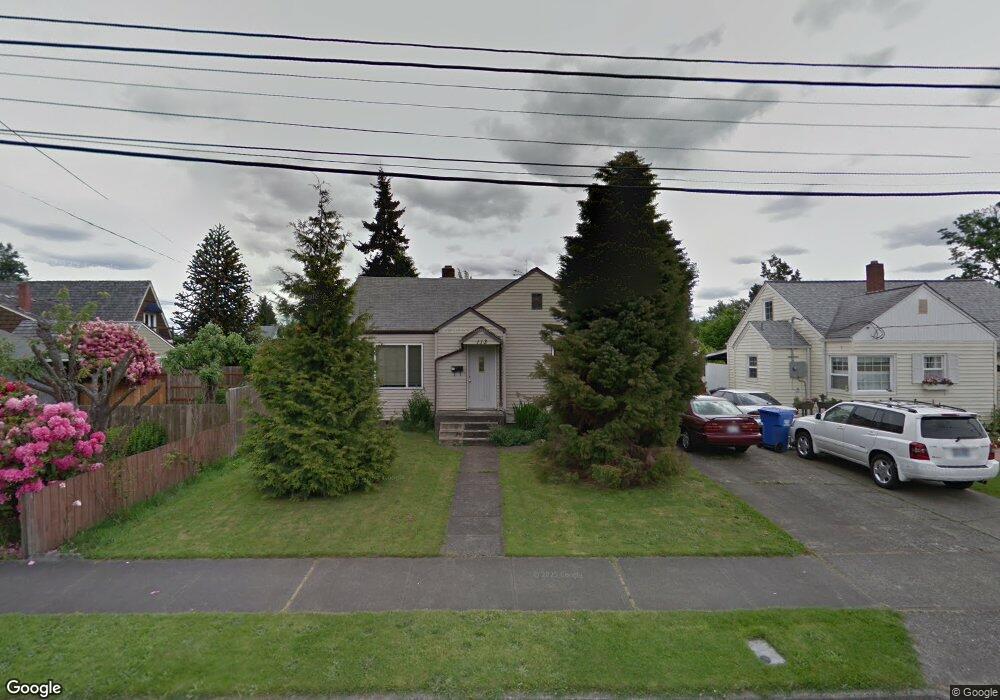
113 12th St SW Puyallup, WA 98371
Estimated Value: $432,000 - $480,000
3
Beds
1
Bath
1,451
Sq Ft
$320/Sq Ft
Est. Value
About This Home
This home is located at 113 12th St SW, Puyallup, WA 98371 and is currently estimated at $463,779, approximately $319 per square foot. 113 12th St SW is a home located in Pierce County with nearby schools including Maplewood Elementary School, Aylen Junior High School, and Puyallup High School.
Ownership History
Date
Name
Owned For
Owner Type
Purchase Details
Closed on
Feb 17, 2005
Sold by
Bailey Trapper
Bought by
Evans Patti L
Current Estimated Value
Home Financials for this Owner
Home Financials are based on the most recent Mortgage that was taken out on this home.
Original Mortgage
$164,250
Outstanding Balance
$74,689
Interest Rate
4.17%
Mortgage Type
Purchase Money Mortgage
Estimated Equity
$389,090
Purchase Details
Closed on
Aug 29, 2001
Sold by
Hannah Timothy M
Bought by
Bailey Trapper and Moffatt Annick
Home Financials for this Owner
Home Financials are based on the most recent Mortgage that was taken out on this home.
Original Mortgage
$138,720
Interest Rate
7.09%
Mortgage Type
VA
Purchase Details
Closed on
May 17, 1996
Sold by
Hurlbert Dennis R and Hurlbert Shelly D
Bought by
Hannah Timothy M
Home Financials for this Owner
Home Financials are based on the most recent Mortgage that was taken out on this home.
Original Mortgage
$98,800
Interest Rate
7%
Create a Home Valuation Report for This Property
The Home Valuation Report is an in-depth analysis detailing your home's value as well as a comparison with similar homes in the area
Home Values in the Area
Average Home Value in this Area
Purchase History
| Date | Buyer | Sale Price | Title Company |
|---|---|---|---|
| Evans Patti L | $182,500 | Ticor Title Of Wa Inc | |
| Bailey Trapper | $136,000 | -- | |
| Hannah Timothy M | $104,000 | First American Title Ins Co |
Source: Public Records
Mortgage History
| Date | Status | Borrower | Loan Amount |
|---|---|---|---|
| Open | Evans Patti L | $164,250 | |
| Previous Owner | Bailey Trapper | $138,720 | |
| Previous Owner | Hannah Timothy M | $98,800 |
Source: Public Records
Tax History Compared to Growth
Tax History
| Year | Tax Paid | Tax Assessment Tax Assessment Total Assessment is a certain percentage of the fair market value that is determined by local assessors to be the total taxable value of land and additions on the property. | Land | Improvement |
|---|---|---|---|---|
| 2025 | $3,559 | $401,600 | $217,900 | $183,700 |
| 2024 | $3,559 | $384,200 | $192,100 | $192,100 |
| 2023 | $3,559 | $356,000 | $177,700 | $178,300 |
| 2022 | $3,561 | $377,300 | $193,300 | $184,000 |
| 2021 | $3,263 | $268,600 | $128,500 | $140,100 |
| 2019 | $2,827 | $248,700 | $116,500 | $132,200 |
| 2018 | $2,870 | $229,800 | $105,600 | $124,200 |
| 2017 | $2,612 | $206,900 | $87,600 | $119,300 |
| 2016 | $2,331 | $165,500 | $65,400 | $100,100 |
| 2014 | $2,082 | $153,000 | $57,700 | $95,300 |
| 2013 | $2,082 | $137,800 | $48,900 | $88,900 |
Source: Public Records
Map
Nearby Homes