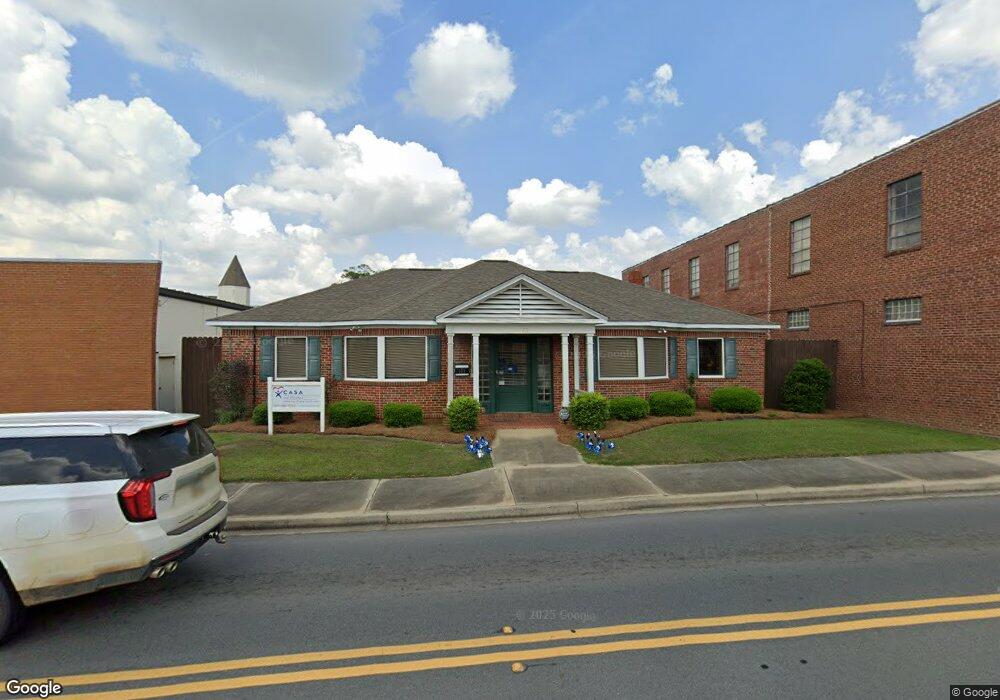
113 2 Nd St E Tifton, GA 31794
Estimated Value: $334,811
Studio
--
Bath
2,474
Sq Ft
$135/Sq Ft
Est. Value
About This Home
This home is located at 113 2 Nd St E, Tifton, GA 31794 and is currently estimated at $334,811, approximately $135 per square foot. 113 2 Nd St E is a home located in Tift County with nearby schools including Charles Spencer Elementary School, J.T. Reddick School, and Len Lastinger Primary School.
Ownership History
Date
Name
Owned For
Owner Type
Purchase Details
Closed on
Aug 11, 2016
Sold by
Tifton Magnolia Properties Llc
Bought by
Coastal Plains Casa Inc
Current Estimated Value
Home Financials for this Owner
Home Financials are based on the most recent Mortgage that was taken out on this home.
Original Mortgage
$87,135
Interest Rate
3.42%
Mortgage Type
Commercial
Purchase Details
Closed on
Sep 10, 2014
Sold by
Sumner Properties Llc
Bought by
Tifton Magnolia Properties Llc
Purchase Details
Closed on
Mar 1, 2011
Sold by
Branch Terri Roberts
Bought by
The Citizens Bank
Purchase Details
Closed on
Apr 13, 2000
Sold by
Sumner J Dale Et Al D/B/A Sps Rentals
Bought by
Branch Terri Roberts
Purchase Details
Closed on
Mar 18, 1999
Sold by
Sps Rentals
Bought by
Sps Properties Llc
Purchase Details
Closed on
Jul 23, 1996
Sold by
Sumner J Dale Et Al D/B/A Sps Rentals
Bought by
Branch Terri Roberts
Purchase Details
Closed on
Oct 11, 1995
Sold by
Morris Leonard
Bought by
Sps Rentals
Create a Home Valuation Report for This Property
The Home Valuation Report is an in-depth analysis detailing your home's value as well as a comparison with similar homes in the area
Purchase History
| Date | Buyer | Sale Price | Title Company |
|---|---|---|---|
| Coastal Plains Casa Inc | $160,000 | -- | |
| Tifton Magnolia Properties Llc | -- | -- | |
| Tifton Magnolia Properties Llc | $30,000 | -- | |
| The Citizens Bank | -- | -- | |
| Branch Terri Roberts | -- | -- | |
| Sps Properties Llc | -- | -- | |
| Branch Terri Roberts | $47,500 | -- | |
| Sps Rentals | $520,000 | -- |
Source: Public Records
Mortgage History
| Date | Status | Borrower | Loan Amount |
|---|---|---|---|
| Closed | Coastal Plains Casa Inc | $87,135 |
Source: Public Records
Tax History
| Year | Tax Paid | Tax Assessment Tax Assessment Total Assessment is a certain percentage of the fair market value that is determined by local assessors to be the total taxable value of land and additions on the property. | Land | Improvement |
|---|---|---|---|---|
| 2025 | -- | $65,150 | $7,560 | $57,590 |
| 2024 | -- | $65,150 | $7,560 | $57,590 |
| 2023 | $1,409 | $37,448 | $8,785 | $28,663 |
| 2022 | $1,409 | $37,448 | $8,785 | $28,663 |
| 2021 | $1,418 | $37,448 | $8,785 | $28,663 |
| 2020 | $1,373 | $34,405 | $8,785 | $25,620 |
| 2019 | $1,373 | $34,405 | $8,785 | $25,620 |
| 2018 | $1,373 | $34,405 | $8,785 | $25,620 |
| 2017 | $0 | $34,405 | $8,785 | $25,620 |
| 2016 | $1,296 | $32,464 | $8,785 | $23,679 |
| 2015 | $479 | $32,646 | $8,785 | $23,861 |
| 2014 | $1,306 | $32,646 | $8,785 | $23,861 |
| 2013 | -- | $32,646 | $8,785 | $23,860 |
Source: Public Records
Map
Nearby Homes
- 401 Park Ave N
- 378 Ellen's Walk
- 372 Ellen's Walk
- N/A Wanda Way
- 14084 Hwy 125n
- 628 Whitetail
- 0 N 0 Park N
- 0 N Tift Ave Unit 141346
- 0 N Tift Ave Unit 7717290
- 0 Georgia 125
- 810 Tift Ave N
- 416 6th St W
- 409 Davis Ave
- 414 E 6th St
- 810 Davis Ave
- 1001 Prince Ave Unit 6
- 1001 Prince Ave
- 15 acres Us Highway 41
- 33.7 ac Us Highway 41
- 48 acres Us Highway 41
Your Personal Tour Guide
Ask me questions while you tour the home.