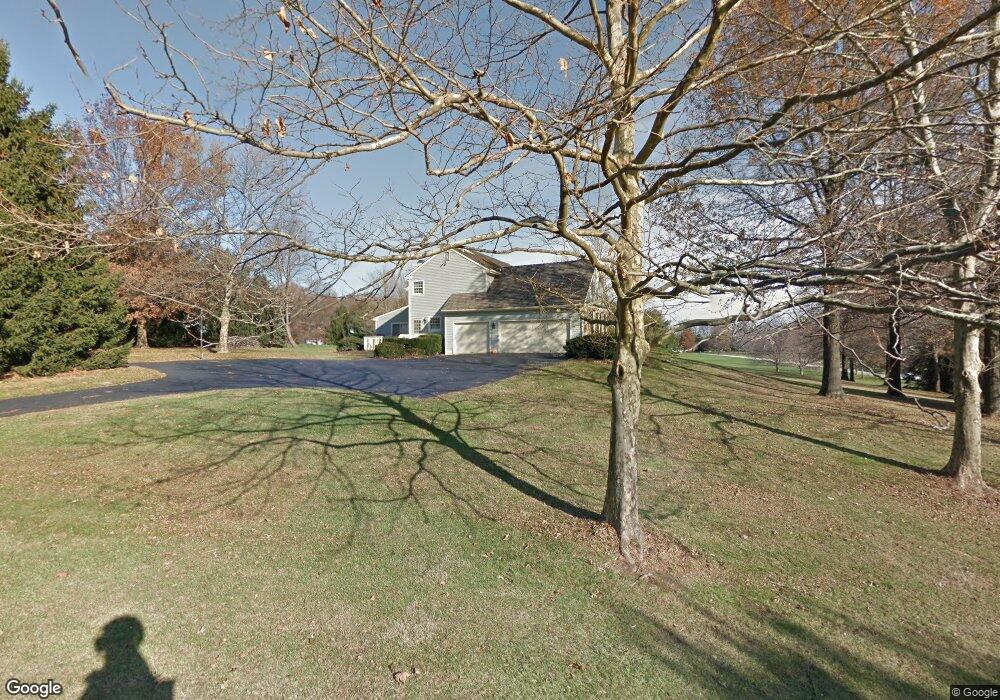
113 3 Ponds Ln Malvern, PA 19355
Estimated Value: $1,034,078 - $1,363,000
4
Beds
3
Baths
3,900
Sq Ft
$302/Sq Ft
Est. Value
About This Home
This home is located at 113 3 Ponds Ln, Malvern, PA 19355 and is currently estimated at $1,177,770, approximately $301 per square foot. 113 3 Ponds Ln is a home located in Chester County with nearby schools including Charlestown Elementary School, Great Valley Middle School, and Great Valley High School.
Ownership History
Date
Name
Owned For
Owner Type
Purchase Details
Closed on
May 5, 2017
Sold by
Price Nicole Bennett
Bought by
Price Nicole B and Price Matthew
Current Estimated Value
Purchase Details
Closed on
Jul 27, 2012
Sold by
Slaby John P and Slaby Jennifer
Bought by
Price Nicole Bennett
Home Financials for this Owner
Home Financials are based on the most recent Mortgage that was taken out on this home.
Original Mortgage
$396,000
Outstanding Balance
$274,717
Interest Rate
3.7%
Mortgage Type
New Conventional
Estimated Equity
$903,053
Purchase Details
Closed on
Oct 25, 2010
Sold by
Deprince Michael and Deprince Katherine L
Bought by
Slaby John P and Slaby Jennifer
Home Financials for this Owner
Home Financials are based on the most recent Mortgage that was taken out on this home.
Original Mortgage
$417,000
Interest Rate
4.41%
Mortgage Type
New Conventional
Create a Home Valuation Report for This Property
The Home Valuation Report is an in-depth analysis detailing your home's value as well as a comparison with similar homes in the area
Home Values in the Area
Average Home Value in this Area
Purchase History
| Date | Buyer | Sale Price | Title Company |
|---|---|---|---|
| Price Nicole B | -- | None Available | |
| Price Nicole Bennett | $660,000 | Fidelity Natl Title Ins Co | |
| Slaby John P | $565,000 | None Available |
Source: Public Records
Mortgage History
| Date | Status | Borrower | Loan Amount |
|---|---|---|---|
| Open | Price Nicole Bennett | $396,000 | |
| Previous Owner | Slaby John P | $417,000 |
Source: Public Records
Tax History Compared to Growth
Tax History
| Year | Tax Paid | Tax Assessment Tax Assessment Total Assessment is a certain percentage of the fair market value that is determined by local assessors to be the total taxable value of land and additions on the property. | Land | Improvement |
|---|---|---|---|---|
| 2025 | $9,244 | $319,200 | $171,630 | $147,570 |
| 2024 | $9,244 | $319,200 | $171,630 | $147,570 |
| 2023 | $9,008 | $319,200 | $171,630 | $147,570 |
| 2022 | $8,829 | $319,200 | $171,630 | $147,570 |
| 2021 | $8,654 | $319,200 | $171,630 | $147,570 |
| 2020 | $8,513 | $319,200 | $171,630 | $147,570 |
| 2019 | $8,431 | $319,200 | $171,630 | $147,570 |
| 2018 | $8,273 | $319,200 | $171,630 | $147,570 |
| 2017 | $8,273 | $319,200 | $171,630 | $147,570 |
| 2016 | $11,359 | $319,200 | $171,630 | $147,570 |
| 2015 | $11,359 | $319,200 | $171,630 | $147,570 |
| 2014 | $11,359 | $319,200 | $171,630 | $147,570 |
Source: Public Records
Map
Nearby Homes
- 3098 Merlin Rd
- 20-F Constant Spring Rd
- 20-L Constant Spring Rd
- 20 Constant Spring Rd
- Lot1-20 Constant Spring Rd
- 17 Theresa Dr
- 25 Dickson Dr
- 3047 Yellow Springs Rd
- 554 Merlin Rd
- 1799 Pickering Rd
- 2585 Charlestown Rd
- 106 Shilling Ave
- 120 Elizabeth Ct
- 105 Yorktown Ct
- 108 Elizabeth Ct
- 118 Tudor Ct
- 103 Elizabeth Ct
- 477 Willann Dr
- 204 Yorktown Ct
- Lot 1 Union Hill Rd
- 113 3 Ponds Ln
- 139 3 Ponds Ln
- 150 3 Ponds Ln
- 115 3 Ponds Ln
- 142 3 Ponds Ln
- 142 3 Ponds Ln
- 150 3 Ponds Ln
- 140 3 Ponds Ln
- 140 3 Ponds Ln
- 138 3 Ponds Ln
- 144 3 Ponds Ln
- 148 3 Ponds Ln
- 148 3 Ponds Ln
- 2336 Pikeland Rd
- 146 3 Ponds Ln
- 146 3 Ponds Ln
- 125 3 Ponds Ln
- 146 Three Ponds Rd
- 116 3 Ponds Ln
- 136 3 Ponds Ln