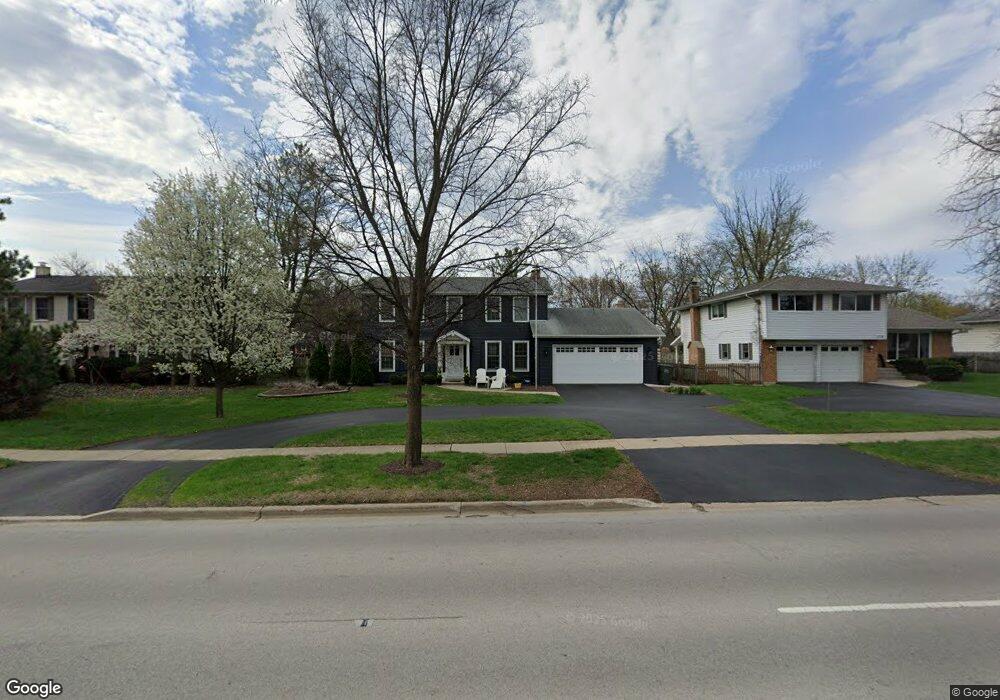
113 55th St Downers Grove, IL 60515
Estimated Value: $475,771 - $632,000
--
Bed
1
Bath
2,301
Sq Ft
$242/Sq Ft
Est. Value
About This Home
This home is located at 113 55th St, Downers Grove, IL 60515 and is currently estimated at $556,943, approximately $242 per square foot. 113 55th St is a home located in DuPage County with nearby schools including Fairmount Elementary School, O'Neill Middle School, and Downers Grove South High School.
Ownership History
Date
Name
Owned For
Owner Type
Purchase Details
Closed on
Sep 25, 1998
Sold by
Lange August C and Lange Roseann M
Bought by
Woywod George M and Woywod Kathleen M
Current Estimated Value
Home Financials for this Owner
Home Financials are based on the most recent Mortgage that was taken out on this home.
Original Mortgage
$209,950
Outstanding Balance
$46,284
Interest Rate
6.98%
Estimated Equity
$510,659
Purchase Details
Closed on
Jun 16, 1997
Sold by
Lavezzi Wayne L and Lavezzi Vladinka
Bought by
Lange August C and Lange Roseann M
Home Financials for this Owner
Home Financials are based on the most recent Mortgage that was taken out on this home.
Original Mortgage
$130,000
Interest Rate
8.01%
Create a Home Valuation Report for This Property
The Home Valuation Report is an in-depth analysis detailing your home's value as well as a comparison with similar homes in the area
Home Values in the Area
Average Home Value in this Area
Purchase History
| Date | Buyer | Sale Price | Title Company |
|---|---|---|---|
| Woywod George M | $221,000 | -- | |
| Lange August C | $216,000 | Collar Counties Title Plant |
Source: Public Records
Mortgage History
| Date | Status | Borrower | Loan Amount |
|---|---|---|---|
| Open | Woywod George M | $209,950 | |
| Previous Owner | Lange August C | $130,000 |
Source: Public Records
Tax History Compared to Growth
Tax History
| Year | Tax Paid | Tax Assessment Tax Assessment Total Assessment is a certain percentage of the fair market value that is determined by local assessors to be the total taxable value of land and additions on the property. | Land | Improvement |
|---|---|---|---|---|
| 2024 | $7,037 | $130,917 | $64,039 | $66,878 |
| 2023 | $6,678 | $120,350 | $58,870 | $61,480 |
| 2022 | $6,451 | $115,610 | $56,550 | $59,060 |
| 2021 | $5,896 | $114,300 | $55,910 | $58,390 |
| 2020 | $5,784 | $112,030 | $54,800 | $57,230 |
| 2019 | $5,597 | $107,490 | $52,580 | $54,910 |
| 2018 | $5,523 | $105,030 | $52,300 | $52,730 |
| 2017 | $4,865 | $90,450 | $50,330 | $40,120 |
| 2016 | $4,763 | $86,320 | $48,030 | $38,290 |
| 2015 | $4,704 | $81,210 | $45,190 | $36,020 |
| 2014 | $5,335 | $88,770 | $48,970 | $39,800 |
| 2013 | $5,226 | $88,350 | $48,740 | $39,610 |
Source: Public Records
Map
Nearby Homes
- 128 8th St
- 232 55th St
- 205 White Fawn Trail
- 315 S Park St
- 5518 Wilcox Ave
- 5519 Fairview Ave
- 440 Lindley Ave
- 302 S Washington St
- 5740 Raintree Ln
- 5201 Florence Ave
- 5316 Fairview Ave
- 305 3rd St
- 5632 Fairview Ave
- 5341 Grand Ave
- 532 W 59th St
- 305 S Adams St
- 5836 Doe Cir Unit 11
- 425 Hill St
- 206 S Adams St
- 306 S Grant St