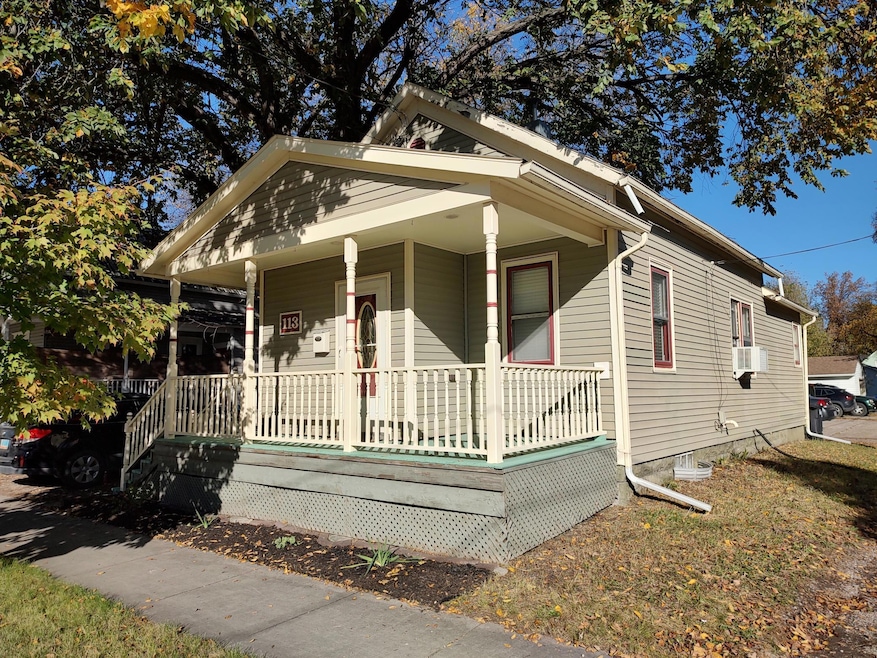
113 6th Ave N Fargo, ND 58102
Horace Mann NeighborhoodEstimated payment $1,006/month
Highlights
- No HOA
- Living Room
- Forced Air Heating System
- Horace Mann Roosevelt Elementary School Rated 9+
- 1-Story Property
About This Home
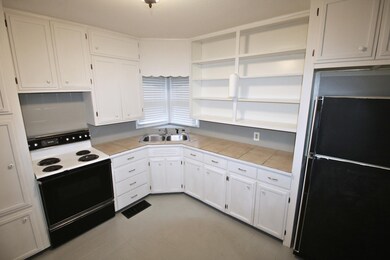
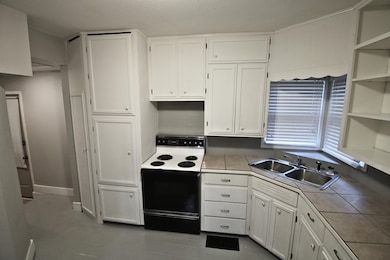
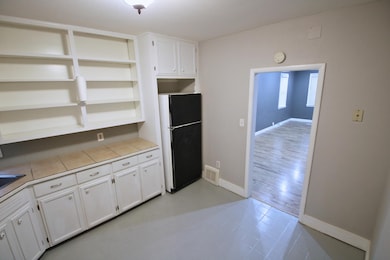
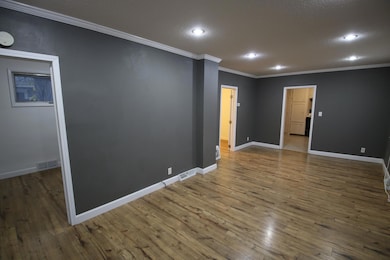
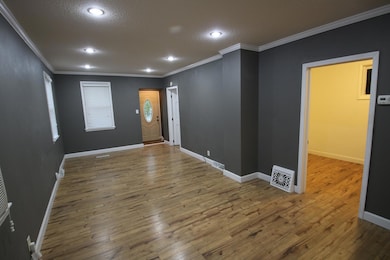
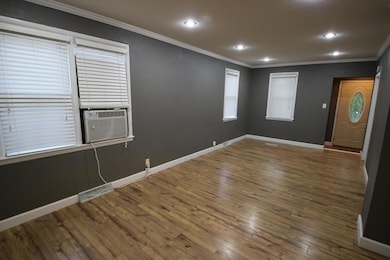
Just six blocks from Sanford Medical Center, this cozy two-bedroom rambler sits on the northern edge of downtown. Close to parks, restaurants, coffee shops, and all the action. Inside, enjoy tasteful updates throughout: fresh paint, newer flooring, and a bright, comfortable living space that is move-in ready. With minimal yard maintenance, this is a rare find for anyone who values location and convenience over square footage. You simply will not find this kind of value anywhere else in the heart of Fargo.
Home Details
Home Type
- Single Family
Est. Annual Taxes
- $2,360
Year Built
- Built in 1898
Lot Details
- 2,570 Sq Ft Lot
- Lot Dimensions are 50 x 52
Home Design
- Vinyl Siding
Interior Spaces
- 760 Sq Ft Home
- 1-Story Property
- Living Room
- Basement
- Basement Storage
- Range
Bedrooms and Bathrooms
- 2 Bedrooms
- 1 Full Bathroom
Laundry
- Dryer
- Washer
Utilities
- Window Unit Cooling System
- Forced Air Heating System
Community Details
- No Home Owners Association
- Keeney & Devitts 2Nd Subdivision
Listing and Financial Details
- Assessor Parcel Number 01154003140000
Map
Home Values in the Area
Average Home Value in this Area
Tax History
| Year | Tax Paid | Tax Assessment Tax Assessment Total Assessment is a certain percentage of the fair market value that is determined by local assessors to be the total taxable value of land and additions on the property. | Land | Improvement |
|---|---|---|---|---|
| 2024 | $2,360 | $74,200 | $12,500 | $61,700 |
| 2023 | $2,273 | $71,350 | $12,500 | $58,850 |
| 2022 | $2,128 | $64,850 | $12,500 | $52,350 |
| 2021 | $2,046 | $62,950 | $12,500 | $50,450 |
| 2020 | $2,024 | $62,950 | $12,500 | $50,450 |
| 2019 | $1,666 | $49,300 | $5,800 | $43,500 |
| 2018 | $1,649 | $49,300 | $5,800 | $43,500 |
| 2017 | $1,206 | $46,950 | $5,800 | $41,150 |
| 2016 | $1,074 | $45,600 | $5,800 | $39,800 |
| 2015 | $974 | $38,750 | $4,900 | $33,850 |
| 2014 | $951 | $36,900 | $4,900 | $32,000 |
| 2013 | $453 | $35,150 | $4,900 | $30,250 |
Property History
| Date | Event | Price | List to Sale | Price per Sq Ft |
|---|---|---|---|---|
| 10/23/2025 10/23/25 | For Sale | $154,300 | -- | $203 / Sq Ft |
Purchase History
| Date | Type | Sale Price | Title Company |
|---|---|---|---|
| Warranty Deed | $109,200 | Title Co | |
| Interfamily Deed Transfer | -- | Title Co | |
| Warranty Deed | $91,000 | Title Co | |
| Warranty Deed | $77,300 | -- | |
| Warranty Deed | -- | -- |
Mortgage History
| Date | Status | Loan Amount | Loan Type |
|---|---|---|---|
| Open | $105,924 | New Conventional | |
| Previous Owner | $63,700 | New Conventional | |
| Previous Owner | $15,460 | Credit Line Revolving | |
| Previous Owner | $61,840 | Adjustable Rate Mortgage/ARM |
Source: NorthstarMLS
MLS Number: 6808374
APN: 01-1540-03140-000
Disclaimer: Certain information contained herein is derived from information provided by parties other than Homes.com. All information provided is deemed reliable, but is not guaranteed to be accurate and should be independently verified.
![]() Based on information submitted to the MLS GRID. All data is obtained from various sources and may not have been verified by broker or MLS GRID. Supplied Open House Information is subject to change without notice. All information should be independently reviewed and verified for accuracy. Properties may or may not be listed by the office/agent presenting the information. Some IDX listings have been excluded from this website.
Based on information submitted to the MLS GRID. All data is obtained from various sources and may not have been verified by broker or MLS GRID. Supplied Open House Information is subject to change without notice. All information should be independently reviewed and verified for accuracy. Properties may or may not be listed by the office/agent presenting the information. Some IDX listings have been excluded from this website.
The Digital Millennium Copyright Act of 1998, 17 U.S.C. § 512 (the “DMCA”) provides recourse for copyright owners who believe that material appearing on the Internet infringes their rights under U.S. copyright law. If you believe in good faith that any content or material made available in connection with our website or services infringes your copyright, you (or your agent) may send us a notice requesting that the content or material be removed, or access to it blocked.
Notices must be sent in writing by email to DMCAnotice@MLSGrid.com.
The DMCA requires that your notice of alleged copyright infringement include the following information:
(1) description of the copyrighted work that is the subject of claimed infringement;
(2) description of the alleged infringing content and information sufficient to permit us to locate the content;
(3) contact information for you, including your address, telephone number and email address;
(4) a statement by you that you have a good faith belief that the content in the manner complained of is not authorized by the copyright owner, or its agent, or by the operation of any law;
(5) a statement by you, signed under penalty of perjury, that the information in the notification is accurate and that you have the authority to enforce the copyrights that are claimed to be infringed; and
(6) a physical or electronic signature of the copyright owner or a person authorized to act on the copyright owner’s behalf. Failure to include all of the above information may result in the delay of the processing of your complaint.
- 609 3rd St N
- 51 6th Ave N
- 505 Oak St N Unit 503
- 505 Oak St N Unit 501
- 726 Oak St N
- 200 4th Ave N Unit 201
- 200 4th Ave N Unit 102
- 727 Oak St N
- 730 Elm St N Unit B1
- 823 3rd St N
- 412 5th St N Unit 506
- 412 5th St N Unit 526
- 412 5th St N Unit 508
- 901 3rd St N
- 305 Broadway N Unit 300
- 57 North Terrace N
- 105 3rd St N Unit 506
- 300 Broadway N Unit 204
- 300 Broadway N Unit 305
- 214 Broadway N
- 202 6th Ave N
- 419 3rd St N
- 720 3rd St N
- 505 Oak St N
- 374 5th St N
- 405 Broadway N
- 719 7th St N
- 606 7th St N Unit Two
- 606 7th St N Unit Two
- 606 7th St N Unit Two
- 223 Roberts St N
- 620 9th Ave
- 625 2nd Ave N
- 624 2nd Ave N
- 630 1st Ave N
- 26 Roberts St N
- 714 11th Ave N
- 820 10th Ave N
- 234 Main Ave
- 819 10th Ave N
