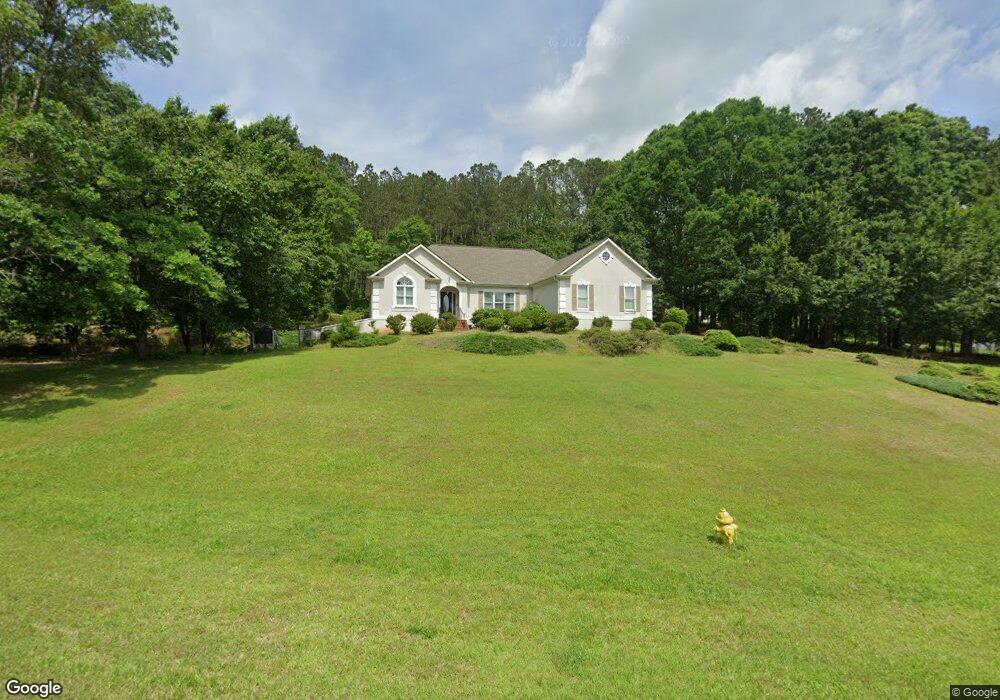
113 Agape St Williamson, GA 30292
Spalding County NeighborhoodEstimated Value: $346,000 - $449,000
3
Beds
3
Baths
3,030
Sq Ft
$130/Sq Ft
Est. Value
About This Home
This home is located at 113 Agape St, Williamson, GA 30292 and is currently estimated at $394,309, approximately $130 per square foot. 113 Agape St is a home located in Spalding County with nearby schools including Moreland Road Elementary School, Carver Road Middle School, and Griffin High School.
Ownership History
Date
Name
Owned For
Owner Type
Purchase Details
Closed on
Jan 10, 2023
Sold by
Elder William David
Bought by
Elder William David and Elder Vickie Jones
Current Estimated Value
Purchase Details
Closed on
Apr 21, 2021
Sold by
Hulon Troy A
Bought by
Elder William David
Home Financials for this Owner
Home Financials are based on the most recent Mortgage that was taken out on this home.
Original Mortgage
$289,656
Interest Rate
3.1%
Mortgage Type
FHA
Purchase Details
Closed on
Apr 5, 2016
Sold by
Palmer Mary Sue
Bought by
Palmer Mary Sue and Hulon Donald A
Purchase Details
Closed on
Apr 10, 2012
Sold by
Palmer Mary Sue
Bought by
Palmer Mary Sue
Purchase Details
Closed on
Oct 24, 2002
Sold by
Eddy Mildred
Bought by
Palmer Thomas and Palmer Mary S
Home Financials for this Owner
Home Financials are based on the most recent Mortgage that was taken out on this home.
Original Mortgage
$102,800
Interest Rate
6.21%
Mortgage Type
New Conventional
Purchase Details
Closed on
Jul 2, 1992
Sold by
Ussery Thomas W
Bought by
Eddy Mildred
Create a Home Valuation Report for This Property
The Home Valuation Report is an in-depth analysis detailing your home's value as well as a comparison with similar homes in the area
Home Values in the Area
Average Home Value in this Area
Purchase History
| Date | Buyer | Sale Price | Title Company |
|---|---|---|---|
| Elder William David | -- | -- | |
| Elder William David | $295,000 | -- | |
| Palmer Mary Sue | -- | -- | |
| Palmer Mary Sue | -- | -- | |
| Palmer Thomas | $253,500 | -- | |
| Eddy Mildred | $11,000 | -- |
Source: Public Records
Mortgage History
| Date | Status | Borrower | Loan Amount |
|---|---|---|---|
| Previous Owner | Elder William David | $289,656 | |
| Previous Owner | Palmer Thomas | $102,800 | |
| Previous Owner | Palmer Thomas | $100,000 |
Source: Public Records
Tax History
| Year | Tax Paid | Tax Assessment Tax Assessment Total Assessment is a certain percentage of the fair market value that is determined by local assessors to be the total taxable value of land and additions on the property. | Land | Improvement |
|---|---|---|---|---|
| 2025 | $3,189 | $106,769 | $10,000 | $96,769 |
| 2024 | $3,231 | $106,769 | $10,000 | $96,769 |
| 2023 | $3,415 | $106,769 | $10,000 | $96,769 |
| 2022 | $3,531 | $95,490 | $10,000 | $85,490 |
| 2021 | $2,279 | $84,030 | $10,000 | $74,030 |
| 2020 | $2,366 | $84,030 | $10,000 | $74,030 |
| 2019 | $2,411 | $84,030 | $10,000 | $74,030 |
| 2018 | $2,345 | $78,342 | $10,000 | $68,342 |
| 2017 | $2,271 | $78,342 | $10,000 | $68,342 |
| 2016 | $482 | $74,355 | $10,000 | $64,355 |
| 2015 | $527 | $74,355 | $10,000 | $64,355 |
| 2014 | $530 | $74,355 | $10,000 | $64,355 |
Source: Public Records
Map
Nearby Homes
- 474 N Rover Rd
- 235 Kendall Dr
- 243 Kendall Dr
- 90 & 212 Kendall Dr
- 673 Maloy Rd
- 1621 Rover Zetella Rd
- 0 Newnan Rd Unit 7718043
- 0 Newnan Rd Unit 10689747
- 1691A Rover Zetella Rd
- 103 Jacqueline Dr
- 107 Jacqueline Dr
- 3861 Newnan Rd
- 90 Rivers Rd
- 2650 Williamson Rd
- 158 Merrybrook Rd
- 365 Merrybrook Rd
- 13 Chappell Hill Rd
- 135 Vaughn Rd
- 1833 Abbey Rd
- 1861 Abbey Rd
- 0 Agape St Unit 7093096
- 0 Agape St Unit 7210166
- 0 Agape St Unit 9041920
- 0 Agape St Unit M161603
- 0 Agape St Unit 8724006
- 0 Agape St Unit 8844634
- 103 Canaan Ct
- 101 Agape St
- 118 Bethel Ln
- 114 Agape St
- 106 Agape St
- 102 Bethel Ln
- 107 Canaan Ct
- 122 Agape St
- 100 Agape St
- 100 Agape
- 127 Agape St
- 106 Bethel Ln
- 109 Bethel Ln
- 126 Agape St
Your Personal Tour Guide
Ask me questions while you tour the home.