113 Amy Ln Carrollton, GA 30117
Estimated Value: $374,013 - $396,000
3
Beds
2
Baths
2,887
Sq Ft
$133/Sq Ft
Est. Value
About This Home
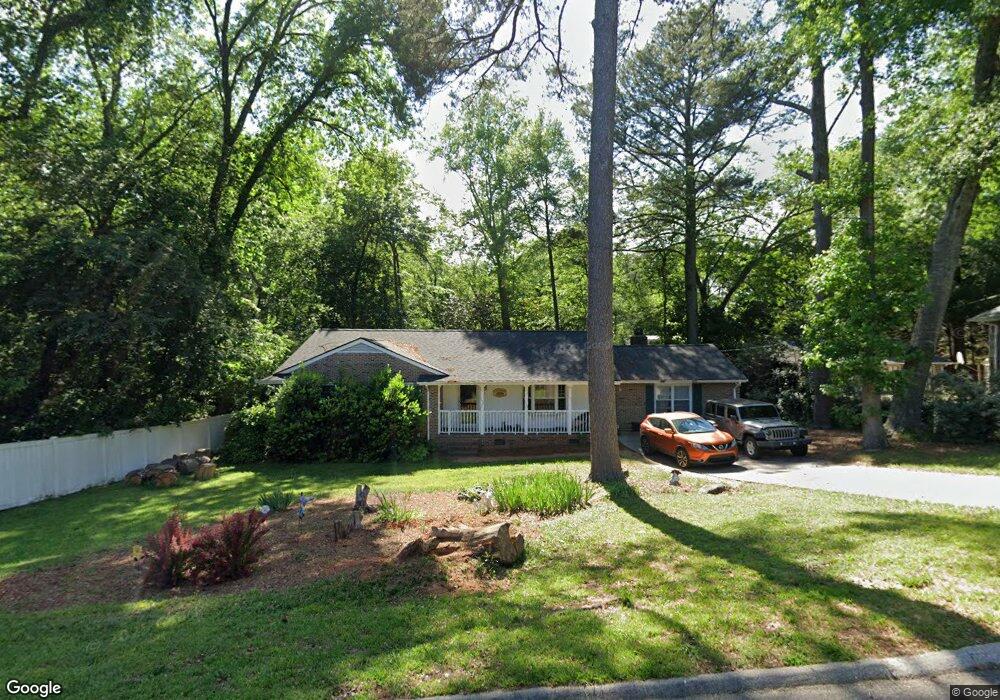
This home is located at 113 Amy Ln, Carrollton, GA 30117 and is currently estimated at $385,003, approximately $133 per square foot. 113 Amy Ln is a home located in Carroll County with nearby schools including Carrollton Elementary School, Carrollton Upper Elementary School, and Carrollton Middle School.
Ownership History
Date
Name
Owned For
Owner Type
Purchase Details
Closed on
Jul 15, 2021
Sold by
Sharp Thomas J
Bought by
Bolan David Campbell and Bolan Sandra Angela
Current Estimated Value
Home Financials for this Owner
Home Financials are based on the most recent Mortgage that was taken out on this home.
Original Mortgage
$140,000
Outstanding Balance
$127,087
Interest Rate
2.93%
Mortgage Type
New Conventional
Estimated Equity
$257,916
Purchase Details
Closed on
Jun 29, 1971
Bought by
Sharp Thomas and Sharp Diann
Create a Home Valuation Report for This Property
The Home Valuation Report is an in-depth analysis detailing your home's value as well as a comparison with similar homes in the area
Home Values in the Area
Average Home Value in this Area
Purchase History
| Date | Buyer | Sale Price | Title Company |
|---|---|---|---|
| Bolan David Campbell | $270,000 | -- | |
| Sharp Thomas | -- | -- |
Source: Public Records
Mortgage History
| Date | Status | Borrower | Loan Amount |
|---|---|---|---|
| Open | Bolan David Campbell | $140,000 |
Source: Public Records
Tax History Compared to Growth
Tax History
| Year | Tax Paid | Tax Assessment Tax Assessment Total Assessment is a certain percentage of the fair market value that is determined by local assessors to be the total taxable value of land and additions on the property. | Land | Improvement |
|---|---|---|---|---|
| 2024 | $3,668 | $140,151 | $34,101 | $106,050 |
| 2023 | $3,668 | $130,408 | $34,102 | $96,306 |
| 2022 | $2,179 | $74,660 | $22,734 | $51,926 |
| 2021 | $489 | $61,328 | $16,826 | $44,502 |
| 2020 | $468 | $56,464 | $16,826 | $39,638 |
| 2019 | $467 | $53,654 | $16,826 | $36,828 |
| 2018 | $469 | $50,597 | $16,826 | $33,771 |
| 2017 | $475 | $50,597 | $16,826 | $33,771 |
| 2016 | $477 | $50,597 | $16,826 | $33,771 |
| 2015 | $459 | $45,334 | $8,618 | $36,716 |
| 2014 | $462 | $45,334 | $8,618 | $36,716 |
Source: Public Records
Map
Nearby Homes
- 117 Orion Terrace
- 308 Old Mill Dr
- 105 Haygood Place
- 98 Millstream Ct
- 141 Bowen St
- 74 Old Mill Ct
- 142 Griffin Dr
- 516 Longview St
- 0 Hwy 27 None N
- 166 Maple St
- 219 Broad St
- 223 Sunset Blvd
- 1818 Maple St
- 27 South St
- 102 Windmill Way
- 160 Watson St
- 423 Clifton Terrace
- 301 Bradley St
- 116 Manor Way
- 109 S Park St