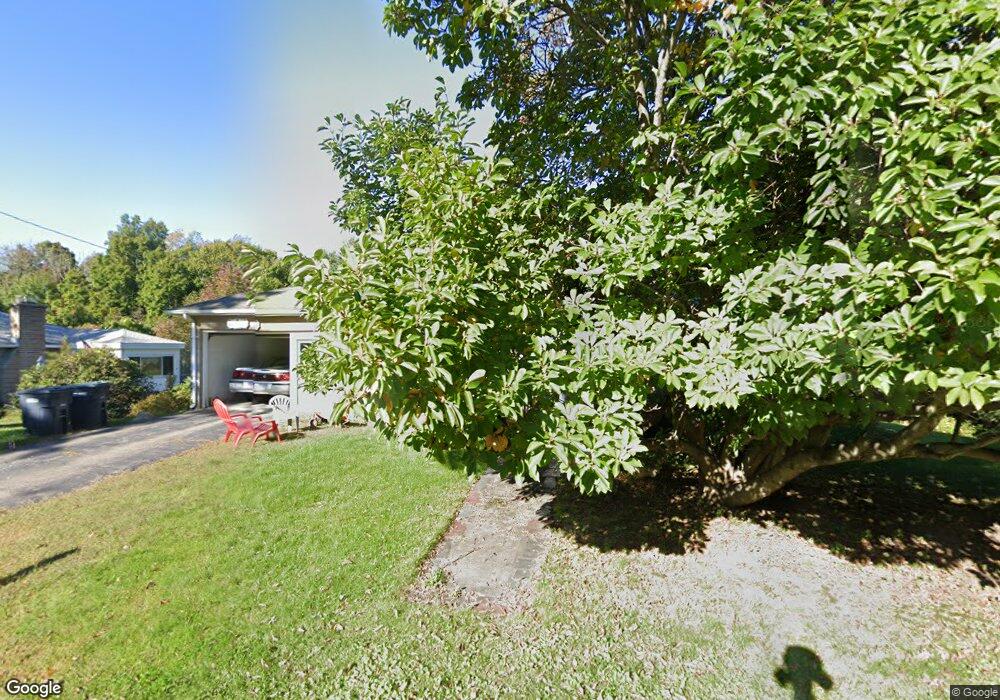
113 Auburn St Cherry Valley, MA 01611
Estimated Value: $367,153 - $391,000
2
Beds
1
Bath
1,006
Sq Ft
$376/Sq Ft
Est. Value
About This Home
This home is located at 113 Auburn St, Cherry Valley, MA 01611 and is currently estimated at $378,538, approximately $376 per square foot. 113 Auburn St is a home located in Worcester County with nearby schools including Leicester Integrated Preschool, Leicester Memorial Elementary School, and Leicester Middle School.
Ownership History
Date
Name
Owned For
Owner Type
Purchase Details
Closed on
Apr 25, 2017
Sold by
Paradise Lloyd W and Paradise Albertine T
Bought by
Paradise Ft and Paradise
Current Estimated Value
Purchase Details
Closed on
Dec 7, 2012
Sold by
Paradise Llyod W
Bought by
Paradise Albertine T
Purchase Details
Closed on
Jul 7, 1992
Sold by
Paradise Lloyd W and Hebert Virginia
Bought by
Paradise Lloyd W
Create a Home Valuation Report for This Property
The Home Valuation Report is an in-depth analysis detailing your home's value as well as a comparison with similar homes in the area
Home Values in the Area
Average Home Value in this Area
Purchase History
| Date | Buyer | Sale Price | Title Company |
|---|---|---|---|
| Paradise Ft | -- | -- | |
| Paradise Ft | -- | -- | |
| Paradise Ft | -- | -- | |
| Paradise Albertine T | -- | -- | |
| Paradise Albertine T | -- | -- | |
| Paradise Albertine T | -- | -- | |
| Paradise Lloyd W | $45,000 | -- | |
| Paradise Lloyd W | $45,000 | -- |
Source: Public Records
Tax History
| Year | Tax Paid | Tax Assessment Tax Assessment Total Assessment is a certain percentage of the fair market value that is determined by local assessors to be the total taxable value of land and additions on the property. | Land | Improvement |
|---|---|---|---|---|
| 2025 | $38 | $320,700 | $75,200 | $245,500 |
| 2024 | $3,569 | $284,400 | $65,100 | $219,300 |
| 2023 | $3,404 | $264,700 | $65,100 | $199,600 |
| 2022 | $3,299 | $235,800 | $62,200 | $173,600 |
| 2021 | $3,436 | $227,100 | $62,200 | $164,900 |
| 2020 | $2,904 | $194,800 | $58,900 | $135,900 |
| 2019 | $2,746 | $182,100 | $52,800 | $129,300 |
| 2018 | $2,658 | $165,200 | $52,800 | $112,400 |
| 2017 | $2,536 | $163,800 | $52,800 | $111,000 |
| 2016 | $2,444 | $164,000 | $65,800 | $98,200 |
| 2015 | $2,385 | $164,000 | $65,800 | $98,200 |
Source: Public Records
Map
Nearby Homes
- 46 Chapel St
- 500 Main St
- 135 Henshaw St
- 1511 Main St Unit C405
- 315 Stafford St
- 2 Shelter Ridge Rd
- 13 Merchant St
- 27 Havana Rd
- 66 Ledgecrest Dr
- 76 Parsons Hill Dr Unit A
- 11 Timrod Dr
- 56 Goddard Memorial Dr
- 32 Goddard Memorial Dr
- 55 Grandview Ave
- 128 Wildwood Ave
- 35 Genessee St Unit E
- 27 Winslow Ave
- 103 Henshaw St
- 26 Sylvan St
- 664 Stafford St
Your Personal Tour Guide
Ask me questions while you tour the home.