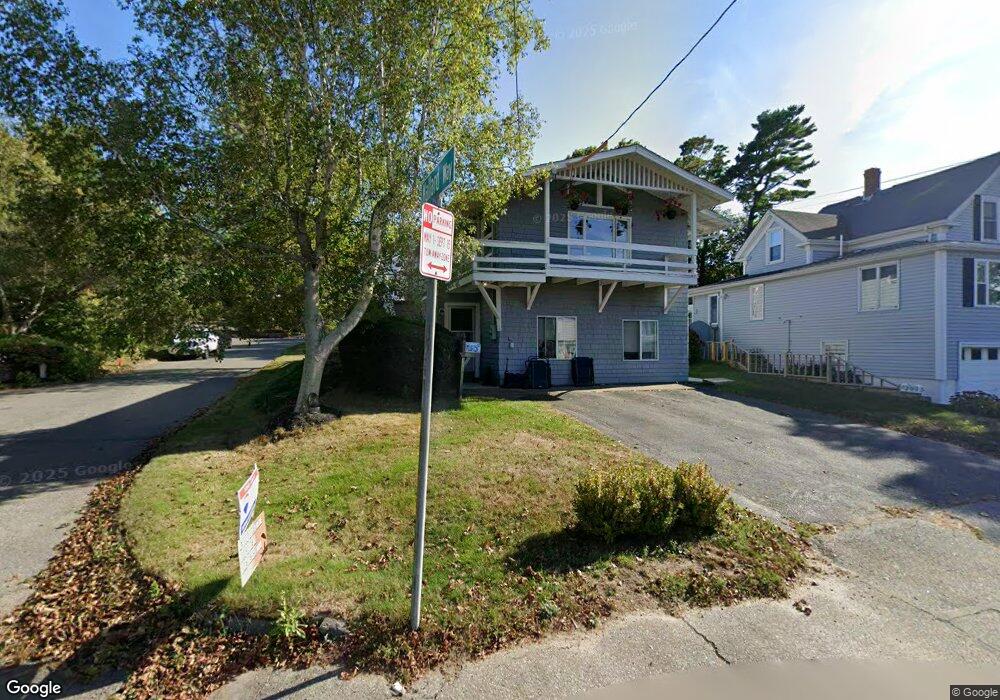
113 Bass Ave Gloucester, MA 01930
East Gloucester NeighborhoodEstimated Value: $689,000 - $1,147,000
4
Beds
2
Baths
816
Sq Ft
$1,004/Sq Ft
Est. Value
About This Home
This home is located at 113 Bass Ave, Gloucester, MA 01930 and is currently estimated at $819,566, approximately $1,004 per square foot. 113 Bass Ave is a home located in Essex County with nearby schools including East Gloucester Elementary School, Ralph B O'maley Middle School, and Gloucester High School.
Ownership History
Date
Name
Owned For
Owner Type
Purchase Details
Closed on
Apr 1, 1994
Sold by
Jeuvelis Anthony
Bought by
Belanger William D and Belanger Lynne
Current Estimated Value
Home Financials for this Owner
Home Financials are based on the most recent Mortgage that was taken out on this home.
Original Mortgage
$166,800
Interest Rate
7.07%
Mortgage Type
Purchase Money Mortgage
Create a Home Valuation Report for This Property
The Home Valuation Report is an in-depth analysis detailing your home's value as well as a comparison with similar homes in the area
Home Values in the Area
Average Home Value in this Area
Purchase History
| Date | Buyer | Sale Price | Title Company |
|---|---|---|---|
| Belanger William D | $208,500 | -- |
Source: Public Records
Mortgage History
| Date | Status | Borrower | Loan Amount |
|---|---|---|---|
| Open | Belanger William D | $100,000 | |
| Closed | Belanger William D | $100,000 | |
| Closed | Belanger William D | $166,800 | |
| Previous Owner | Belanger William D | $109,900 |
Source: Public Records
Tax History
| Year | Tax Paid | Tax Assessment Tax Assessment Total Assessment is a certain percentage of the fair market value that is determined by local assessors to be the total taxable value of land and additions on the property. | Land | Improvement |
|---|---|---|---|---|
| 2025 | $6,894 | $709,300 | $432,600 | $276,700 |
| 2024 | $6,675 | $686,000 | $411,900 | $274,100 |
| 2023 | $6,701 | $632,800 | $367,700 | $265,100 |
| 2022 | $6,366 | $542,700 | $319,900 | $222,800 |
| 2021 | $6,149 | $494,300 | $290,800 | $203,500 |
| 2020 | $5,047 | $409,300 | $217,400 | $191,900 |
| 2019 | $4,886 | $385,000 | $217,400 | $167,600 |
| 2018 | $4,363 | $337,400 | $189,100 | $148,300 |
| 2017 | $4,196 | $318,100 | $180,100 | $138,000 |
| 2016 | $4,086 | $300,200 | $170,900 | $129,300 |
| 2015 | $4,044 | $296,300 | $170,900 | $125,400 |
Source: Public Records
Map
Nearby Homes
- 70 Bass Ave
- 26 Marina Dr
- 3 Mondello Square
- 78 Thatcher Rd Unit 6
- 11 Wall St Unit R
- 36 Eastern Ave
- 129 Thatcher Rd
- 32 Witham St Unit B
- 25 Salt Island Rd
- 197 E Main St Unit 1
- 21 Marble Rd
- 23 Mount Vernon St
- 14R Spring St Unit 3
- 60 Rocky Neck Ave Unit 202
- 73 Rocky Neck Ave Unit 2
- 10 Seaview Rd
- 50 Warner St
- 191 Main St Unit 3
- 191 Main St Unit 2A
- 113 Pleasant St
- 111 Bass Ave
- 117 Bass Ave
- 109 Bass Ave
- 4 Atlantic Rd
- 107 Bass Ave
- 121 Bass Ave
- 122 Bass Ave
- 1 Mallard Way
- 120 Bass Ave
- 120 Bass Ave Unit 120
- 120 Bass Ave Unit 129
- 118 Bass Ave Unit 118
- 2 Atlantic Rd
- 2 Atlantic Rd Unit 1
- 2 Atlantic Rd Unit 2
- 132 Bass Ave
- 2 Mallard Way
- 6 Atlantic Rd
- 1 Nautilus Rd
- 112 Bass Ave
Your Personal Tour Guide
Ask me questions while you tour the home.