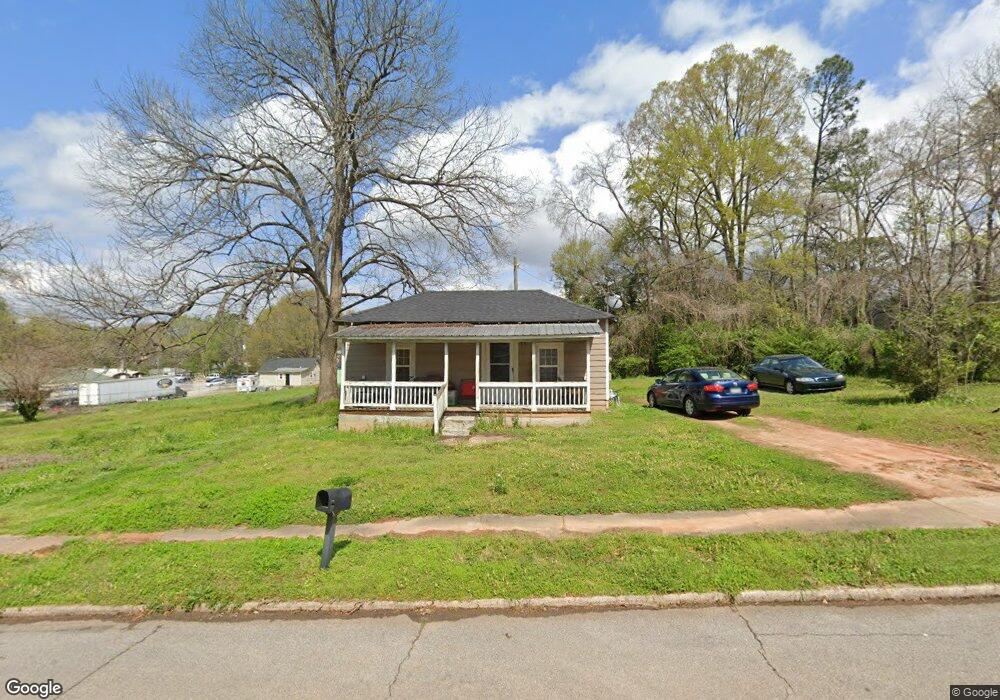
113 Bell St Lagrange, GA 30241
Estimated Value: $65,000 - $85,000
2
Beds
1
Bath
728
Sq Ft
$101/Sq Ft
Est. Value
About This Home
This home is located at 113 Bell St, Lagrange, GA 30241 and is currently estimated at $73,674, approximately $101 per square foot. 113 Bell St is a home located in Troup County with nearby schools including Callaway Elementary School, Hogansville Elementary School, and Callaway Middle School.
Ownership History
Date
Name
Owned For
Owner Type
Purchase Details
Closed on
Nov 30, 2021
Sold by
T Squared 1 Llc
Bought by
Brbrshy Investments Inc
Current Estimated Value
Purchase Details
Closed on
Jun 1, 2021
Sold by
Stribling Ty
Bought by
T Squared 1 Llc
Purchase Details
Closed on
Nov 5, 2003
Sold by
Otis E Stribling
Bought by
Stribling Ty
Purchase Details
Closed on
Dec 3, 1997
Sold by
Leola Thompson
Bought by
Otis E Stribling
Purchase Details
Closed on
Nov 27, 1991
Sold by
Stribling Phillip E
Bought by
Leola Thompson
Purchase Details
Closed on
Jul 2, 1985
Sold by
Heard Lonnie and Heard Arlish
Bought by
Stribling Phillip E
Purchase Details
Closed on
Sep 4, 1981
Sold by
Heard Lonnie and Heard Arlisha
Bought by
Heard Lonnie and Heard Arlish
Purchase Details
Closed on
Aug 30, 1976
Sold by
Bass Kate
Bought by
Heard Lonnie and Heard Arlisha
Purchase Details
Closed on
Jan 1, 1959
Sold by
Mallory Mrs A E-No Deed Bk and Mallory Pg
Bought by
Bass Kate
Create a Home Valuation Report for This Property
The Home Valuation Report is an in-depth analysis detailing your home's value as well as a comparison with similar homes in the area
Purchase History
| Date | Buyer | Sale Price | Title Company |
|---|---|---|---|
| Brbrshy Investments Inc | $12,484,500 | -- | |
| T Squared 1 Llc | -- | -- | |
| Stribling Ty | $283,700 | -- | |
| Otis E Stribling | -- | -- | |
| Leola Thompson | -- | -- | |
| Stribling Phillip E | $1,000 | -- | |
| Heard Lonnie | -- | -- | |
| Heard Lonnie | $2,500 | -- | |
| Bass Kate | -- | -- |
Source: Public Records
Tax History
| Year | Tax Paid | Tax Assessment Tax Assessment Total Assessment is a certain percentage of the fair market value that is determined by local assessors to be the total taxable value of land and additions on the property. | Land | Improvement |
|---|---|---|---|---|
| 2025 | $628 | $23,040 | $4,000 | $19,040 |
| 2024 | $567 | $20,800 | $4,000 | $16,800 |
| 2023 | $433 | $15,880 | $4,000 | $11,880 |
| 2022 | $423 | $15,160 | $4,000 | $11,160 |
| 2021 | $160 | $5,320 | $2,000 | $3,320 |
| 2020 | $160 | $5,320 | $2,000 | $3,320 |
| 2019 | $145 | $4,800 | $1,600 | $3,200 |
| 2018 | $145 | $4,800 | $1,600 | $3,200 |
| 2017 | $145 | $4,800 | $1,600 | $3,200 |
| 2016 | $137 | $4,532 | $1,508 | $3,024 |
| 2015 | $137 | $4,532 | $1,508 | $3,024 |
| 2014 | $137 | $4,532 | $1,508 | $3,024 |
| 2013 | -- | $4,964 | $1,508 | $3,456 |
Source: Public Records
Map
Nearby Homes
- 109 Bell St
- 103 Cedar St
- 101 Cedar St
- 112 Cedar St
- 0 Boggs St Unit 10550243
- 0 Boggs St Unit 10550231
- 0 Boggs St Unit 10550239
- 0 Boggs St Unit 10550250
- 0 Bagley St
- 304 Butler St
- 901 Whiteline St
- 1191 Whitesville St
- 0 E Fendig St
- 113 E Fendig St
- 1201 Whitesville St
- 501 Milam St
- 1404-1406 Hamilton
- 1404 Hamilton Rd
- 303 E Mulberry St
- 1186 Lindsey St
Your Personal Tour Guide
Ask me questions while you tour the home.