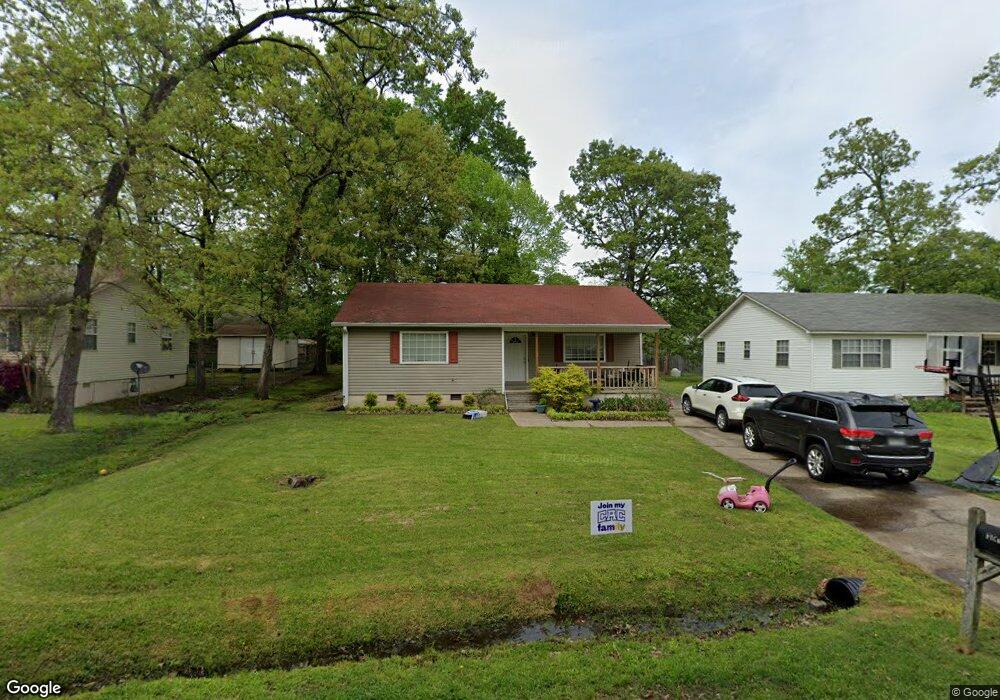
113 Bob o Link Ln Sherwood, AR 72120
Estimated Value: $145,000 - $156,000
3
Beds
2
Baths
1,080
Sq Ft
$140/Sq Ft
Est. Value
About This Home
This home is located at 113 Bob o Link Ln, Sherwood, AR 72120 and is currently estimated at $151,335, approximately $140 per square foot. 113 Bob o Link Ln is a home located in Pulaski County with nearby schools including Sherwood Elementary School, Sylvan Hills Middle School, and Sylvan Hills High School.
Ownership History
Date
Name
Owned For
Owner Type
Purchase Details
Closed on
Sep 7, 2012
Sold by
Jebb William F and Jebb Wynona B
Bought by
Harney Shannon E
Current Estimated Value
Home Financials for this Owner
Home Financials are based on the most recent Mortgage that was taken out on this home.
Original Mortgage
$5,416
Interest Rate
3.62%
Mortgage Type
Stand Alone Second
Purchase Details
Closed on
Mar 17, 2011
Sold by
Jebb William F and Jebb Wynona B
Bought by
Jebb Family Revocable Trust
Purchase Details
Closed on
Aug 16, 2004
Sold by
Taylor Jason Daniel and Taylor Kristen Elaine
Bought by
Jebb William F and Jebb Wynona B
Purchase Details
Closed on
Aug 27, 1998
Sold by
Real Estate Central Inc
Bought by
Taylor Jason Daniel and Taylor Kristen Elaine
Home Financials for this Owner
Home Financials are based on the most recent Mortgage that was taken out on this home.
Original Mortgage
$54,045
Interest Rate
6.64%
Mortgage Type
FHA
Create a Home Valuation Report for This Property
The Home Valuation Report is an in-depth analysis detailing your home's value as well as a comparison with similar homes in the area
Home Values in the Area
Average Home Value in this Area
Purchase History
| Date | Buyer | Sale Price | Title Company |
|---|---|---|---|
| Harney Shannon E | $94,000 | None Available | |
| Jebb Family Revocable Trust | -- | None Available | |
| Jebb William F | $78,000 | Stewart Title Of Arkansas | |
| Taylor Jason Daniel | $54,000 | Beach Abstract & Guaranty Co |
Source: Public Records
Mortgage History
| Date | Status | Borrower | Loan Amount |
|---|---|---|---|
| Closed | Harney Shannon E | $5,416 | |
| Open | Harney Shannon E | $92,297 | |
| Previous Owner | Taylor Jason Daniel | $54,045 |
Source: Public Records
Tax History Compared to Growth
Tax History
| Year | Tax Paid | Tax Assessment Tax Assessment Total Assessment is a certain percentage of the fair market value that is determined by local assessors to be the total taxable value of land and additions on the property. | Land | Improvement |
|---|---|---|---|---|
| 2025 | $1,130 | $22,943 | $3,200 | $19,743 |
| 2024 | $1,036 | $22,943 | $3,200 | $19,743 |
| 2023 | $1,036 | $22,943 | $3,200 | $19,743 |
| 2022 | $1,120 | $22,943 | $3,200 | $19,743 |
| 2021 | $1,040 | $18,090 | $3,300 | $14,790 |
| 2020 | $660 | $18,090 | $3,300 | $14,790 |
| 2019 | $660 | $18,090 | $3,300 | $14,790 |
| 2018 | $661 | $18,090 | $3,300 | $14,790 |
| 2017 | $608 | $18,090 | $3,300 | $14,790 |
| 2016 | $835 | $16,020 | $2,700 | $13,320 |
| 2015 | $814 | $16,020 | $2,700 | $13,320 |
| 2014 | $814 | $16,020 | $2,700 | $13,320 |
Source: Public Records
Map
Nearby Homes
- 121 Bob o Link Ln
- 2206 E Lee Ave
- 2204 E Lee Ave
- 0 Catterton Dr
- 5809 Woodview Dr N
- 5908 Glenhaven Place
- 1926 E Lee Ave
- 2001 E Kiehl Ave
- 8218 Park Ave
- 110 Ann Ave
- 6 Thornhill Dr
- 12 Ridgewell Rd
- +/- 21.56 Acres Stafford Rd
- 1501 Stafford Rd
- 1423 Stafford Rd
- 1419 Stafford Rd
- 1800 Palomino Dr
- 208 Ann Ave
- 20 Oakbrooke Dr
- Lot 2 Witts Dr
- 115 Bob o Link Ln
- 117 Bob o Link Ln
- 117 Bob o Link Ln
- 109 Bob o Link Ln
- 112 Cottonwood Ave
- 112 Bob o Link Ln
- 114 Cottonwood Ave
- 110 Cottonwood Ave
- 116 Cottonwood Ave
- 108 Cottonwood Ave
- 107 Bob o Link Ln
- 119 Bob o Link Ln
- 116 Bob o Link Ln
- 120 Cottonwood Ave
- 0 Cottonwood Ave
- 118 Bob o Link Ln
- 0 Bob o Link Ln
- 105 Bob o Link Ln
- 104 Bob o Link Ln
- 113 Redbud Ave