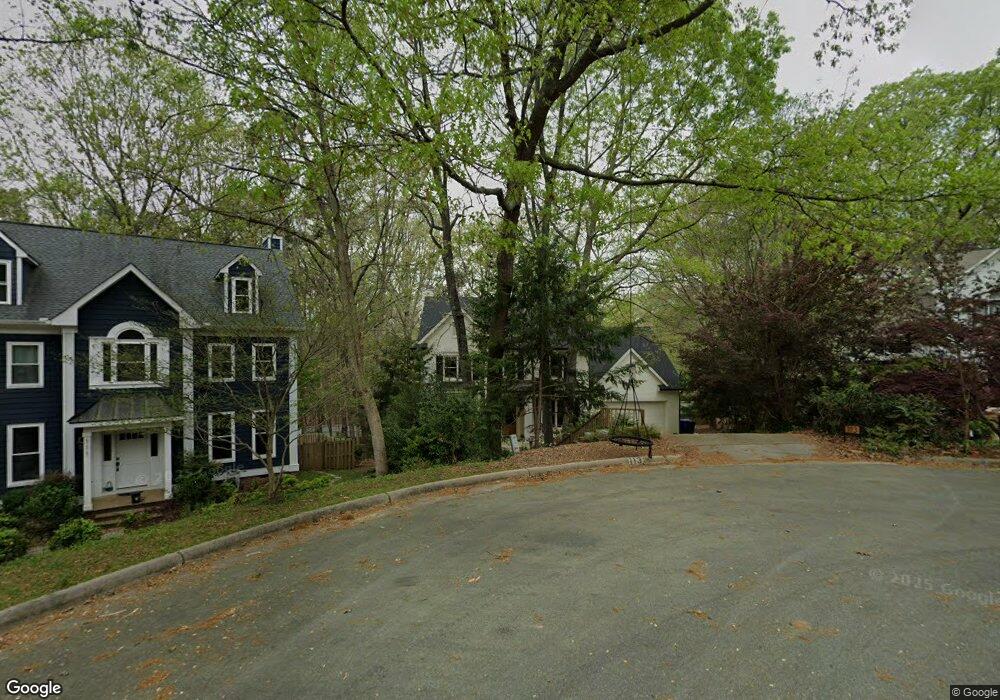
113 Bolton Place Chapel Hill, NC 27516
Estimated Value: $822,000 - $945,000
5
Beds
4
Baths
3,688
Sq Ft
$242/Sq Ft
Est. Value
About This Home
This home is located at 113 Bolton Place, Chapel Hill, NC 27516 and is currently estimated at $891,704, approximately $241 per square foot. 113 Bolton Place is a home located in Orange County with nearby schools including Smith Middle School and Chapel Hill High School.
Ownership History
Date
Name
Owned For
Owner Type
Purchase Details
Closed on
Feb 18, 2021
Sold by
Vrba James and Vrba Lori
Bought by
Mcelwee Patrick Melia and Mcelwee Meghan Danielle
Current Estimated Value
Home Financials for this Owner
Home Financials are based on the most recent Mortgage that was taken out on this home.
Original Mortgage
$543,200
Outstanding Balance
$485,412
Interest Rate
2.65%
Mortgage Type
New Conventional
Estimated Equity
$406,292
Purchase Details
Closed on
Feb 21, 2007
Sold by
Wynmor Evan C and Wynmor Julie M
Bought by
Vrba James and Vrba Lori
Home Financials for this Owner
Home Financials are based on the most recent Mortgage that was taken out on this home.
Original Mortgage
$200,000
Interest Rate
6.3%
Mortgage Type
Unknown
Purchase Details
Closed on
Dec 11, 2001
Sold by
More Robert and More Barbara
Bought by
Wynmor Evan C and Wynmor Julie M
Home Financials for this Owner
Home Financials are based on the most recent Mortgage that was taken out on this home.
Original Mortgage
$263,000
Interest Rate
6.5%
Create a Home Valuation Report for This Property
The Home Valuation Report is an in-depth analysis detailing your home's value as well as a comparison with similar homes in the area
Home Values in the Area
Average Home Value in this Area
Purchase History
| Date | Buyer | Sale Price | Title Company |
|---|---|---|---|
| Mcelwee Patrick Melia | $679,000 | None Available | |
| Vrba James | $469,000 | None Available | |
| Wynmor Evan C | -- | -- |
Source: Public Records
Mortgage History
| Date | Status | Borrower | Loan Amount |
|---|---|---|---|
| Open | Mcelwee Patrick Melia | $543,200 | |
| Previous Owner | Vrba James | $200,000 | |
| Previous Owner | Vrba James | $151,000 | |
| Previous Owner | Wynmor Evan C | $263,000 |
Source: Public Records
Tax History Compared to Growth
Tax History
| Year | Tax Paid | Tax Assessment Tax Assessment Total Assessment is a certain percentage of the fair market value that is determined by local assessors to be the total taxable value of land and additions on the property. | Land | Improvement |
|---|---|---|---|---|
| 2025 | $10,980 | $830,400 | $300,000 | $530,400 |
| 2024 | $8,523 | $498,800 | $105,000 | $393,800 |
| 2023 | $8,289 | $498,800 | $105,000 | $393,800 |
| 2022 | $7,944 | $498,800 | $105,000 | $393,800 |
| 2021 | $7,801 | $496,100 | $105,000 | $391,100 |
| 2020 | $8,244 | $493,400 | $122,000 | $371,400 |
| 2018 | $8,057 | $493,400 | $122,000 | $371,400 |
| 2017 | $8,225 | $493,400 | $122,000 | $371,400 |
| 2016 | $8,225 | $497,606 | $114,177 | $383,429 |
| 2015 | $8,225 | $497,606 | $114,177 | $383,429 |
| 2014 | $8,179 | $497,606 | $114,177 | $383,429 |
Source: Public Records
Map
Nearby Homes
- 221 Ironwoods Dr
- 105 Oldham Place
- 104 Woodleaf Dr
- 1530 Pathway Dr
- 500 Umstead Dr Unit 103
- 500 Umstead Dr Unit 304
- 107 Hillcrest Ave Unit C & D
- 112 Creekview Cir
- 220 Barclay Rd
- 101 Thomas Ln Unit D-3
- 404 Waterside Dr
- 201 Weathervane Dr
- 102 Sue Ann Ct Unit A And B
- 126 Barclay Rd
- 107 Mulberry St Unit B
- 409 Lindsay St
- 219 Columbia Place W
- 506 N Greensboro St Unit 35
- 503 Edwards Dr
- 104 Sparkleberry Ln
- 111 Bolton Place
- 116 Hampshire Place
- 115 Bolton Place
- 108 Brighton Ct
- 117 Hampshire Place
- 112 Hampshire Place
- 112 Brighton Ct
- 112 Bolton Place
- 109 Bolton Place
- 104 Brighton Ct
- 108 Bolton Place Unit 142
- 108 Bolton Place
- 104 Bolton Place
- 113 Hampshire Place
- 108 Hampshire Place
- 113 Emerywood Place
- 113 Brighton Ct
- 407 Ironwoods Dr
- 112 Emerywood Place
- 109 Emerywood Place