113 Brandon Rd Cranston, RI 02910
Cranston AreaEstimated Value: $426,409 - $452,000
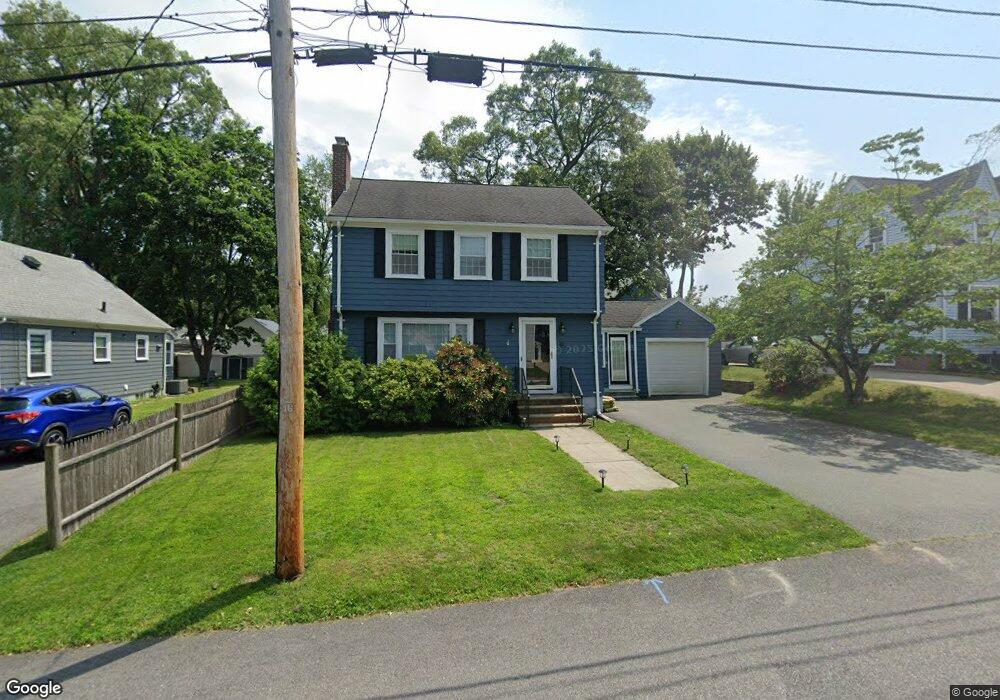
About This Home
This home is located at 113 Brandon Rd, Cranston, RI 02910 and is currently estimated at $440,352, approximately $214 per square foot. 113 Brandon Rd is a home located in Providence County with nearby schools including W. R. Dutemple School, Park View Middle School, and Cranston High School East.
Ownership History
We collect this data history from publicly available records. To have your information removed, we recommend requesting removal directly through your county’s website.
Purchase Details
Purchase History
We collect this data history from publicly available records. To have your information removed, we recommend requesting removal directly through your county’s website.
| Date | Buyer | Sale Price | Title Company |
|---|---|---|---|
| $169,000 | -- |
Mortgage History
We collect this data history from publicly available records. To have your information removed, we recommend requesting removal directly through your county’s website.
| Date | Status | Borrower | Loan Amount |
|---|---|---|---|
| Open | $130,652 |
Tax History
We collect this data history from publicly available records. To have your information removed, we recommend requesting removal directly through your county’s website.
| Year | Tax Paid | Tax Assessment Tax Assessment Total Assessment is a certain percentage of the fair market value that is determined by local assessors to be the total taxable value of land and additions on the property. | Land | Improvement |
|---|---|---|---|---|
| 2025 | $4,621 | $332,900 | $110,300 | $222,600 |
| 2024 | $4,531 | $332,900 | $110,300 | $222,600 |
| 2023 | $4,349 | $230,100 | $72,600 | $157,500 |
| 2022 | $4,259 | $230,100 | $72,600 | $157,500 |
| 2021 | $4,142 | $230,100 | $72,600 | $157,500 |
| 2020 | $4,058 | $195,400 | $69,200 | $126,200 |
| 2019 | $4,058 | $195,400 | $69,200 | $126,200 |
| 2018 | $3,965 | $195,400 | $69,200 | $126,200 |
| 2017 | $4,265 | $185,900 | $62,300 | $123,600 |
| 2016 | $4,173 | $185,900 | $62,300 | $123,600 |
| 2015 | $4,173 | $185,900 | $62,300 | $123,600 |
| 2014 | $3,986 | $174,500 | $62,300 | $112,200 |
Map
- 9 Morgan St
- 53 Alger Ave
- 132 Roger Williams Ave
- 31 Burrows St
- 200 Narragansett Ave
- 113 Beckwith St
- 33 Stadden St
- 217 Pontiac Ave
- 170 Beckwith St
- 61 Burnside St
- 50 Stamford Ave
- 105 Eldridge St
- 137 Reservoir Ave
- 27 Willis St
- 31 Sibley St
- 146 Garden St
- 555 Park Ave
- 57 Algonquin St
- 26 Westmore St
- 25 Lambert St
- 130 Alexander St
- 106 Brandon Rd
- 110 Brandon Rd
- 131 Alexander St
- 103 Friendly Rd
- 109 Friendly Rd
- 112 Brandon Rd
- 111 Friendly Rd
- 114 Brandon Rd
- 140 Alexander St
- 92 Brandon Rd
- 105 Brandon Rd
- 139 Alexander St
- 107 Brandon Rd
- 97 Friendly Rd
- 118 Brandon Rd
- 115 Friendly Rd
- 93 Brandon Rd
- 91 Friendly Rd
- 86 Brandon Rd
Ask me questions while you tour the home.