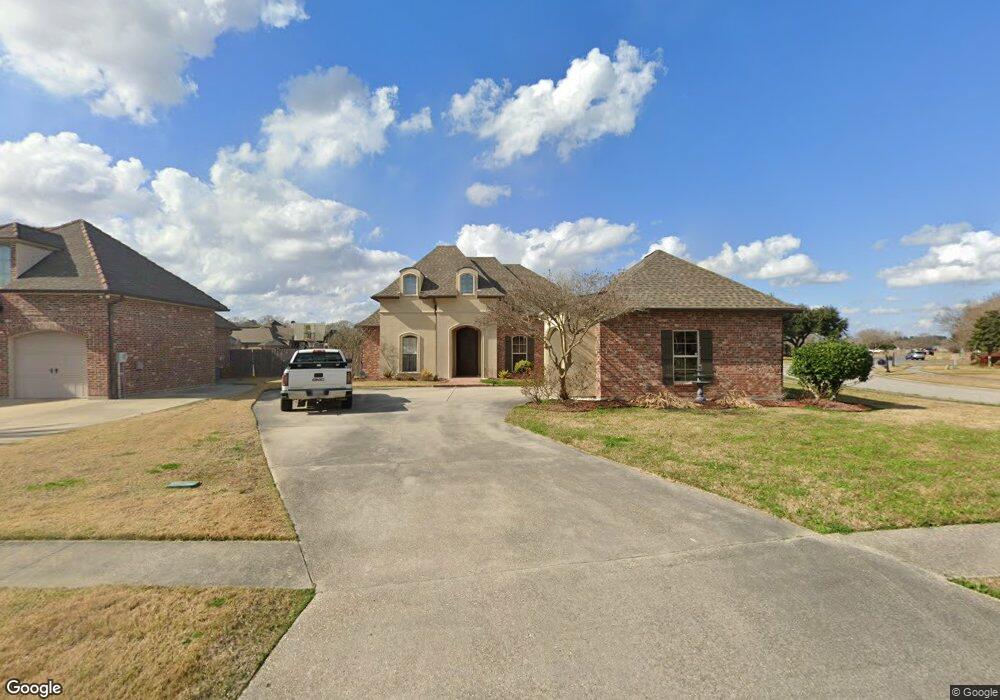
113 Brookhaven Dr Youngsville, LA 70592
Estimated Value: $460,275 - $494,000
4
Beds
3
Baths
2,714
Sq Ft
$176/Sq Ft
Est. Value
About This Home
This home is located at 113 Brookhaven Dr, Youngsville, LA 70592 and is currently estimated at $476,319, approximately $175 per square foot. 113 Brookhaven Dr is a home located in Lafayette Parish with nearby schools including Ernest Gallet Elementary School, Youngsville Middle School, and Southside High School.
Ownership History
Date
Name
Owned For
Owner Type
Purchase Details
Closed on
Dec 18, 2009
Sold by
Cormier Lege Lance and Cormier Lege Jayci Marie
Bought by
Zerangue Simon Shaun Ray and Zerangue Simon Jill
Current Estimated Value
Home Financials for this Owner
Home Financials are based on the most recent Mortgage that was taken out on this home.
Original Mortgage
$201,000
Outstanding Balance
$133,094
Interest Rate
4.82%
Mortgage Type
Future Advance Clause Open End Mortgage
Estimated Equity
$343,225
Purchase Details
Closed on
Apr 2, 2009
Sold by
Biju Kunhrmann and Kunhiraman Sangeetha R
Bought by
Lege Lance and Lege Jayci M
Purchase Details
Closed on
Aug 25, 2006
Sold by
Monceaux Cody Wilfred and Monceaux Julie Hudson
Bought by
Kunhiraman Biju and Kunhiraman Sangeetha R
Purchase Details
Closed on
Jan 5, 2006
Sold by
J C Youngsville Development Llc
Bought by
Monceaux Cody Wilfred and Monceaux Julie Hudson
Create a Home Valuation Report for This Property
The Home Valuation Report is an in-depth analysis detailing your home's value as well as a comparison with similar homes in the area
Home Values in the Area
Average Home Value in this Area
Purchase History
| Date | Buyer | Sale Price | Title Company |
|---|---|---|---|
| Zerangue Simon Shaun Ray | $365,000 | None Available | |
| Lege Lance | $370,000 | None Available | |
| Kunhiraman Biju | $357,000 | None Available | |
| Monceaux Cody Wilfred | $49,000 | None Available |
Source: Public Records
Mortgage History
| Date | Status | Borrower | Loan Amount |
|---|---|---|---|
| Open | Zerangue Simon Shaun Ray | $201,000 |
Source: Public Records
Tax History Compared to Growth
Tax History
| Year | Tax Paid | Tax Assessment Tax Assessment Total Assessment is a certain percentage of the fair market value that is determined by local assessors to be the total taxable value of land and additions on the property. | Land | Improvement |
|---|---|---|---|---|
| 2024 | $3,113 | $38,540 | $6,823 | $31,717 |
| 2023 | $3,113 | $37,175 | $6,823 | $30,352 |
| 2022 | $3,649 | $37,175 | $6,823 | $30,352 |
| 2021 | $3,662 | $37,175 | $6,823 | $30,352 |
| 2020 | $3,660 | $37,175 | $6,823 | $30,352 |
| 2019 | $2,446 | $37,175 | $6,823 | $30,352 |
| 2018 | $2,934 | $37,175 | $6,823 | $30,352 |
| 2017 | $2,931 | $37,175 | $5,458 | $31,717 |
| 2015 | $2,493 | $32,680 | $4,900 | $27,780 |
| 2013 | -- | $32,680 | $4,900 | $27,780 |
Source: Public Records
Map
Nearby Homes
- 406 Quiet Meadows Dr
- 300 Quiet Meadows Dr
- 102 Spring View Dr
- 100 Piedmont Ln
- 312 Quiet Meadows Dr
- 205 Captain Rick Dr
- 101 Cornish Place
- 204 Copper Ridge Dr
- 103 Scarborough Dr
- 105 Quiet Oaks Dr
- 168 Iberia St
- 100 Sweetwater Creek Dr
- 118 Meagans Way Dr
- 122 Preservation Dr
- 127 Preservation Dr
- 419 Copperfield Way
- 102 Madison Woods Cir
- 111 Brookhaven Dr
- 118 Rushmore Ln
- 119 Rushmore Ln
- 116 Rushmore Ln
- 109 Brookhaven Dr
- 114 Brookhaven Dr
- 117 Rushmore Ln
- 116 Brookhaven Dr
- 112 Brookhaven Dr
- 200 Brookhaven Dr
- 107 Brookhaven Dr
- 203 Brookhaven Dr
- 110 Brookhaven Dr
- 101 Fountainview Dr
- 101 Fountain View
- 114 Rushmore Ln
- 115 Rushmore Ln
- 110 Brookhollow Dr
- 118 Meadow Lake Dr
- 100 Fountainview Dr