Estimated Value: $259,495 - $345,000
Studio
1
Bath
1,792
Sq Ft
$166/Sq Ft
Est. Value
About This Home
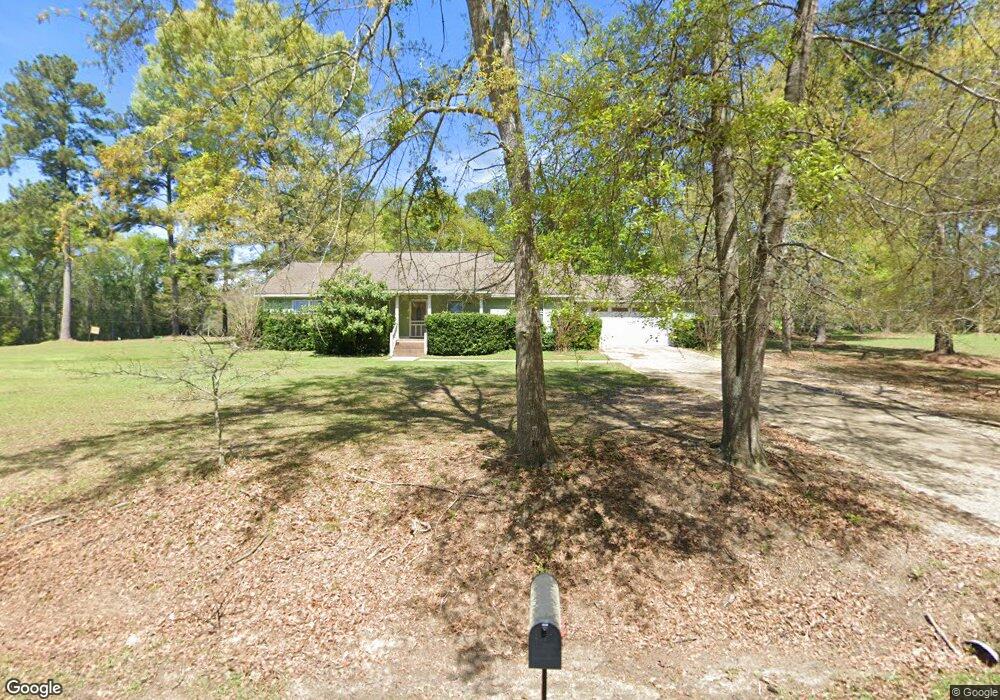
This home is located at 113 Cameron Rd, Cairo, GA 39827 and is currently estimated at $297,874, approximately $166 per square foot. 113 Cameron Rd is a home located in Grady County with nearby schools including Cairo High School.
Ownership History
Date
Name
Owned For
Owner Type
Purchase Details
Closed on
Jan 24, 2023
Sold by
Dean Rebecca Ann
Bought by
Rbd Liv Trust
Current Estimated Value
Purchase Details
Closed on
Nov 4, 2009
Sold by
Basso Clotilda
Bought by
Dean Rebecca Ann Bond
Purchase Details
Closed on
Jun 29, 2007
Sold by
Mills D Ronnie
Bought by
Basso Clotilda
Purchase Details
Closed on
Feb 26, 2007
Sold by
Watson Timothy E
Bought by
Roach Jay A and Ronnie Mills D
Purchase Details
Closed on
Jun 6, 2006
Sold by
Castleberry Allen J
Bought by
Watson Timothy E
Purchase Details
Closed on
Mar 30, 2006
Sold by
Roach Jay A
Bought by
Watson Timothy E
Purchase Details
Closed on
May 12, 1988
Bought by
Castleberry Allen J
Create a Home Valuation Report for This Property
The Home Valuation Report is an in-depth analysis detailing your home's value as well as a comparison with similar homes in the area
Purchase History
| Date | Buyer | Sale Price | Title Company |
|---|---|---|---|
| Rbd Liv Trust | -- | -- | |
| Dean Rebecca Ann Bond | -- | -- | |
| Basso Clotilda | $184,000 | -- | |
| Roach Jay A | -- | -- | |
| Watson Timothy E | $15,000 | -- | |
| Watson Timothy E | -- | -- | |
| Castleberry Allen J | -- | -- |
Source: Public Records
Tax History
| Year | Tax Paid | Tax Assessment Tax Assessment Total Assessment is a certain percentage of the fair market value that is determined by local assessors to be the total taxable value of land and additions on the property. | Land | Improvement |
|---|---|---|---|---|
| 2024 | $2,151 | $79,706 | $8,000 | $71,706 |
| 2023 | $1,772 | $57,548 | $6,000 | $51,548 |
| 2022 | $1,772 | $57,548 | $6,000 | $51,548 |
| 2021 | $1,777 | $57,548 | $6,000 | $51,548 |
| 2020 | $1,783 | $57,548 | $6,000 | $51,548 |
| 2019 | $1,783 | $57,548 | $6,000 | $51,548 |
| 2018 | $1,674 | $57,548 | $6,000 | $51,548 |
| 2017 | $1,594 | $57,548 | $6,000 | $51,548 |
| 2016 | $1,375 | $49,361 | $6,000 | $43,361 |
| 2015 | $1,358 | $49,361 | $6,000 | $43,361 |
| 2014 | $1,360 | $49,361 | $6,000 | $43,361 |
| 2013 | -- | $55,605 | $6,000 | $49,605 |
Source: Public Records
Map
Nearby Homes
Your Personal Tour Guide
Ask me questions while you tour the home.