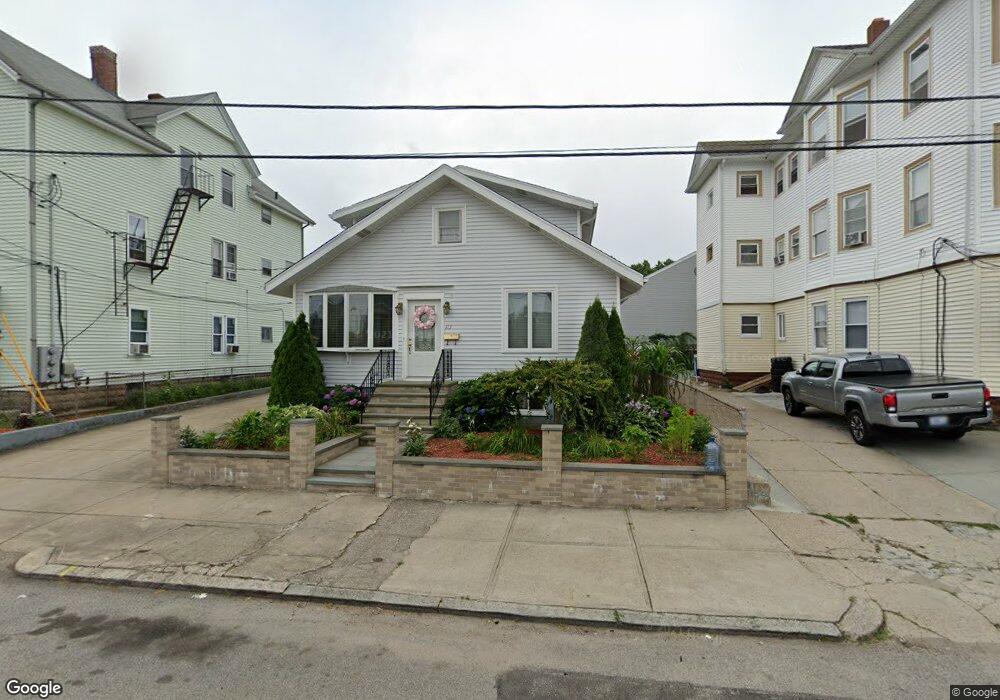
113 Carnation St Pawtucket, RI 02860
Pleasant View NeighborhoodEstimated Value: $398,000 - $440,000
4
Beds
1
Bath
2,200
Sq Ft
$190/Sq Ft
Est. Value
About This Home
This home is located at 113 Carnation St, Pawtucket, RI 02860 and is currently estimated at $418,787, approximately $190 per square foot. 113 Carnation St is a home located in Providence County with nearby schools including St Cecilia School and Saint Raphael Academy.
Ownership History
Date
Name
Owned For
Owner Type
Purchase Details
Closed on
Aug 9, 2019
Sold by
Matos Ft
Bought by
Matos Jose F and Matos Ana M
Current Estimated Value
Home Financials for this Owner
Home Financials are based on the most recent Mortgage that was taken out on this home.
Original Mortgage
$191,250
Outstanding Balance
$166,771
Interest Rate
3.7%
Mortgage Type
New Conventional
Estimated Equity
$252,016
Purchase Details
Closed on
May 15, 2013
Sold by
Matos Kevin
Bought by
Matos Jose F and Matos Ana M
Purchase Details
Closed on
Feb 21, 2013
Sold by
Matos Jose F and Matos Ana M
Bought by
Matos Ft and Matos
Create a Home Valuation Report for This Property
The Home Valuation Report is an in-depth analysis detailing your home's value as well as a comparison with similar homes in the area
Home Values in the Area
Average Home Value in this Area
Purchase History
| Date | Buyer | Sale Price | Title Company |
|---|---|---|---|
| Matos Jose F | -- | -- | |
| Matos Jose F | -- | -- | |
| Matos Ft | -- | -- |
Source: Public Records
Mortgage History
| Date | Status | Borrower | Loan Amount |
|---|---|---|---|
| Open | Matos Jose F | $191,250 | |
| Previous Owner | Matos Ft | $87,000 | |
| Previous Owner | Matos Ft | $121,000 | |
| Previous Owner | Matos Ft | $75,000 |
Source: Public Records
Tax History Compared to Growth
Tax History
| Year | Tax Paid | Tax Assessment Tax Assessment Total Assessment is a certain percentage of the fair market value that is determined by local assessors to be the total taxable value of land and additions on the property. | Land | Improvement |
|---|---|---|---|---|
| 2025 | $4,896 | $372,300 | $127,400 | $244,900 |
| 2024 | $4,594 | $372,300 | $127,400 | $244,900 |
| 2023 | $3,950 | $233,200 | $64,000 | $169,200 |
| 2022 | $3,866 | $233,200 | $64,000 | $169,200 |
| 2021 | $3,866 | $233,200 | $64,000 | $169,200 |
| 2020 | $3,409 | $163,200 | $47,200 | $116,000 |
| 2019 | $3,409 | $163,200 | $47,200 | $116,000 |
| 2018 | $3,285 | $163,200 | $47,200 | $116,000 |
| 2017 | $3,067 | $135,000 | $41,000 | $94,000 |
| 2016 | $2,955 | $135,000 | $41,000 | $94,000 |
| 2015 | $2,955 | $135,000 | $41,000 | $94,000 |
| 2014 | $2,765 | $119,900 | $41,000 | $78,900 |
Source: Public Records
Map
Nearby Homes
- 50 Carnation St Unit 2
- 168 Central Ave
- 176 Central Ave
- 300 Front St Unit 105
- 211 Carnation St
- 54 Sabin St
- 39 Webster St Unit 204
- 396 Roosevelt Ave
- 511 High St
- 517 High St
- 19 Wood St
- 71 Lyon St
- 27 Collins Ave
- 147 Coyle Ave
- 30 Foundry St Unit 6
- 10 Exchange Ct Unit 203
- 10 Exchange Ct Unit 506
- 36 Underwood St
- 27 Aiken St
- 234 Central St Unit 236