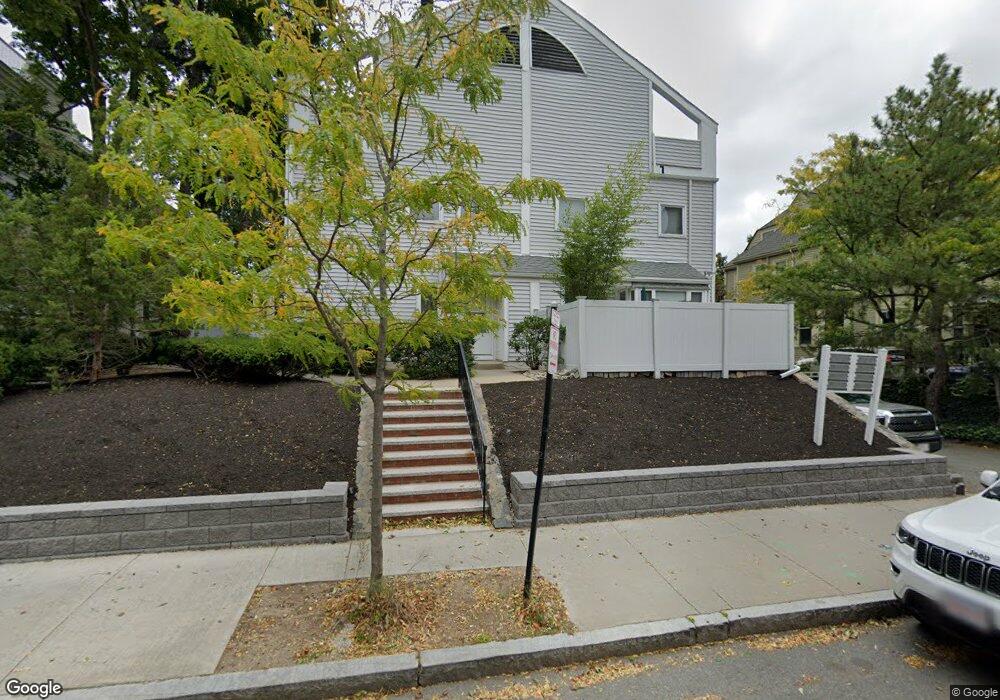
113 Centre St Unit A Brookline, MA 02446
Coolidge Corner NeighborhoodEstimated Value: $1,363,000 - $1,593,000
3
Beds
2
Baths
1,789
Sq Ft
$828/Sq Ft
Est. Value
About This Home
This home is located at 113 Centre St Unit A, Brookline, MA 02446 and is currently estimated at $1,481,668, approximately $828 per square foot. 113 Centre St Unit A is a home located in Norfolk County with nearby schools including Florida Ruffin Ridley, Brookline High School, and Match Charter Public School.
Ownership History
Date
Name
Owned For
Owner Type
Purchase Details
Closed on
Aug 24, 2020
Sold by
Shinrock Eric
Bought by
Greiner Ashley and Gordon Jeremy
Current Estimated Value
Home Financials for this Owner
Home Financials are based on the most recent Mortgage that was taken out on this home.
Original Mortgage
$1,064,000
Outstanding Balance
$942,083
Interest Rate
2.9%
Mortgage Type
Purchase Money Mortgage
Estimated Equity
$539,585
Purchase Details
Closed on
Dec 9, 2016
Sold by
Crawford Gwendolyn M
Bought by
Shinrock Eric
Home Financials for this Owner
Home Financials are based on the most recent Mortgage that was taken out on this home.
Original Mortgage
$417,000
Interest Rate
3.47%
Mortgage Type
New Conventional
Purchase Details
Closed on
Mar 29, 2013
Sold by
Swartz Alan
Bought by
Crawford Gwendolyn M and Swartz Alan
Purchase Details
Closed on
Jan 8, 1990
Sold by
White Glenn M
Bought by
Leeder Gayle A
Purchase Details
Closed on
Oct 2, 1978
Bought by
Swartz Alan and Crawford Gwendolyn M
Create a Home Valuation Report for This Property
The Home Valuation Report is an in-depth analysis detailing your home's value as well as a comparison with similar homes in the area
Home Values in the Area
Average Home Value in this Area
Purchase History
| Date | Buyer | Sale Price | Title Company |
|---|---|---|---|
| Greiner Ashley | $1,330,000 | None Available | |
| Shinrock Eric | $740,000 | -- | |
| Crawford Gwendolyn M | -- | -- | |
| Leeder Gayle A | $289,900 | -- | |
| Swartz Alan | $63,400 | -- |
Source: Public Records
Mortgage History
| Date | Status | Borrower | Loan Amount |
|---|---|---|---|
| Open | Greiner Ashley | $1,064,000 | |
| Previous Owner | Shinrock Eric | $417,000 | |
| Previous Owner | Swartz Alan | $60,000 |
Source: Public Records
Tax History
| Year | Tax Paid | Tax Assessment Tax Assessment Total Assessment is a certain percentage of the fair market value that is determined by local assessors to be the total taxable value of land and additions on the property. | Land | Improvement |
|---|---|---|---|---|
| 2025 | $13,338 | $1,351,400 | $0 | $1,351,400 |
| 2024 | $12,944 | $1,324,900 | $0 | $1,324,900 |
| 2023 | $11,711 | $1,174,600 | $0 | $1,174,600 |
| 2022 | $11,339 | $1,112,800 | $0 | $1,112,800 |
| 2021 | $10,308 | $1,051,800 | $0 | $1,051,800 |
| 2020 | $9,851 | $1,042,400 | $0 | $1,042,400 |
| 2019 | $9,302 | $992,700 | $0 | $992,700 |
| 2018 | $9,207 | $973,300 | $0 | $973,300 |
| 2017 | $8,504 | $860,700 | $0 | $860,700 |
| 2016 | $8,118 | $779,100 | $0 | $779,100 |
| 2015 | $7,564 | $708,200 | $0 | $708,200 |
| 2014 | $7,410 | $650,600 | $0 | $650,600 |
Source: Public Records
Map
Nearby Homes
- 123 Centre St
- 17 Coolidge St
- 62 Fuller St
- 49 Winchester St Unit 2
- 38 Stedman St Unit 38A
- 19 Winchester St Unit 110
- 17 Summit Ave Unit 2
- 20 Winchester St Unit 3
- 52 Babcock St Unit 5
- 52 Babcock St Unit 1
- 95 Mason Terrace Unit 6
- 116 Thorndike St Unit 1
- 116 Thorndike St Unit 2
- 200 Winchester St Unit 1
- 66 Mason Terrace
- 1407 Beacon St Unit 8
- 1490 Beacon St Unit 4
- 14 Green St Unit PHA
- 142 Fuller St Unit 4
- 108 Columbia St Unit 1
- 111 Centre St Unit B
- 111 Centre St Unit A
- 107 Centre St Unit B
- 109 Centre St Unit B
- 109 Centre St Unit A
- 111A Centre St Unit A
- 109 Centre St Unit 109A
- 111A Centre St Unit 111A
- 107 Centre St Unit 107B
- 113 Centre St Unit B
- 113 Centre St Unit 113
- 113 Centre St Unit 113B,113
- 105 Centre St
- 103 Centre St
- 105 Centre St Unit 2
- 121 Centre St Unit PH2
- 121 Centre St Unit PH1
- 121 Centre St Unit 303
- 121 Centre St Unit 302
- 121 Centre St Unit 301
Your Personal Tour Guide
Ask me questions while you tour the home.