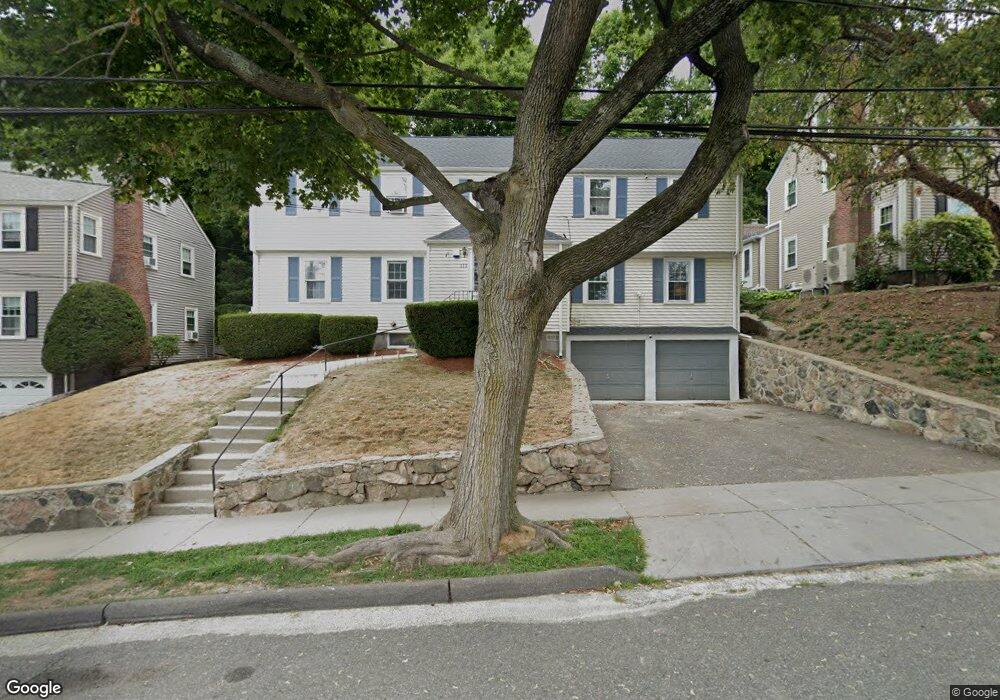
113 Channing Rd Watertown, MA 02472
West Watertown NeighborhoodEstimated Value: $1,228,000 - $1,318,582
6
Beds
3
Baths
3,108
Sq Ft
$406/Sq Ft
Est. Value
About This Home
This home is located at 113 Channing Rd, Watertown, MA 02472 and is currently estimated at $1,261,896, approximately $406 per square foot. 113 Channing Rd is a home located in Middlesex County with nearby schools including The Kendall School and Beacon High School.
Ownership History
Date
Name
Owned For
Owner Type
Purchase Details
Closed on
Apr 25, 2016
Sold by
Reardon Nt
Bought by
Davis Allison M and Davis William G
Current Estimated Value
Home Financials for this Owner
Home Financials are based on the most recent Mortgage that was taken out on this home.
Original Mortgage
$681,572
Outstanding Balance
$544,164
Interest Rate
3.75%
Mortgage Type
FHA
Estimated Equity
$717,732
Create a Home Valuation Report for This Property
The Home Valuation Report is an in-depth analysis detailing your home's value as well as a comparison with similar homes in the area
Home Values in the Area
Average Home Value in this Area
Purchase History
| Date | Buyer | Sale Price | Title Company |
|---|---|---|---|
| Davis Allison M | $700,000 | -- |
Source: Public Records
Mortgage History
| Date | Status | Borrower | Loan Amount |
|---|---|---|---|
| Open | Davis Allison M | $681,572 | |
| Closed | Davis Allison M | $681,572 |
Source: Public Records
Tax History Compared to Growth
Tax History
| Year | Tax Paid | Tax Assessment Tax Assessment Total Assessment is a certain percentage of the fair market value that is determined by local assessors to be the total taxable value of land and additions on the property. | Land | Improvement |
|---|---|---|---|---|
| 2025 | $12,345 | $1,056,900 | $542,500 | $514,400 |
| 2024 | $11,544 | $986,700 | $527,700 | $459,000 |
| 2023 | $13,016 | $958,500 | $504,700 | $453,800 |
| 2022 | $11,743 | $886,300 | $458,900 | $427,400 |
| 2021 | $10,670 | $871,000 | $443,600 | $427,400 |
| 2020 | $10,342 | $851,900 | $428,300 | $423,600 |
| 2019 | $9,190 | $713,500 | $428,300 | $285,200 |
| 2018 | $8,952 | $664,600 | $397,700 | $266,900 |
| 2017 | $8,541 | $614,900 | $348,000 | $266,900 |
| 2016 | $8,151 | $595,800 | $328,900 | $266,900 |
| 2015 | $8,379 | $557,500 | $290,600 | $266,900 |
| 2014 | $8,054 | $538,400 | $271,500 | $266,900 |
Source: Public Records
Map
Nearby Homes
- 47 Fuller Rd Unit 47
- 45 Fuller Rd Unit 45
- 43 Fuller Rd Unit 45
- 50 Carroll St Unit 50
- 748 Belmont St
- 98 Carroll St Unit 98
- 2 Bartlett Ave Unit 1
- 28 Whitney St
- 220 Westminster Ave
- 125 Trapelo Rd Unit 21
- 125 Trapelo Rd Unit 23
- 33 Slade St Unit 1
- 214 Palfrey St
- 456 Belmont St Unit 10
- 456 Belmont St Unit 21
- 59-61 Gilbert Rd
- 15 Elmwood Ave
- 77 Forest St
- 172 Westminster Ave Unit 1
- 9 Bancroft St Unit 11
- 111 Channing Rd
- 111 Channing Rd Unit 1
- 105 Channing Rd Unit 105
- 103 Channing Rd Unit 103
- 103 Channing Rd Unit 105
- 115 Channing Rd
- 42 Fairview Ave
- 36 Fairview Ave Unit 38
- 57 George St
- 44 Fairview Ave Unit 44
- 44 Fairview Ave Unit 2
- 44 Fairview Ave
- 1919 Harriet Ave Unit 19
- 99 Channing Rd Unit 101
- 99 Channing Rd Unit 99
- 123 Channing Rd
- 48 Fairview Ave
- 46 Fairview Ave
- 46 Fairview Ave
- 106 Channing Rd