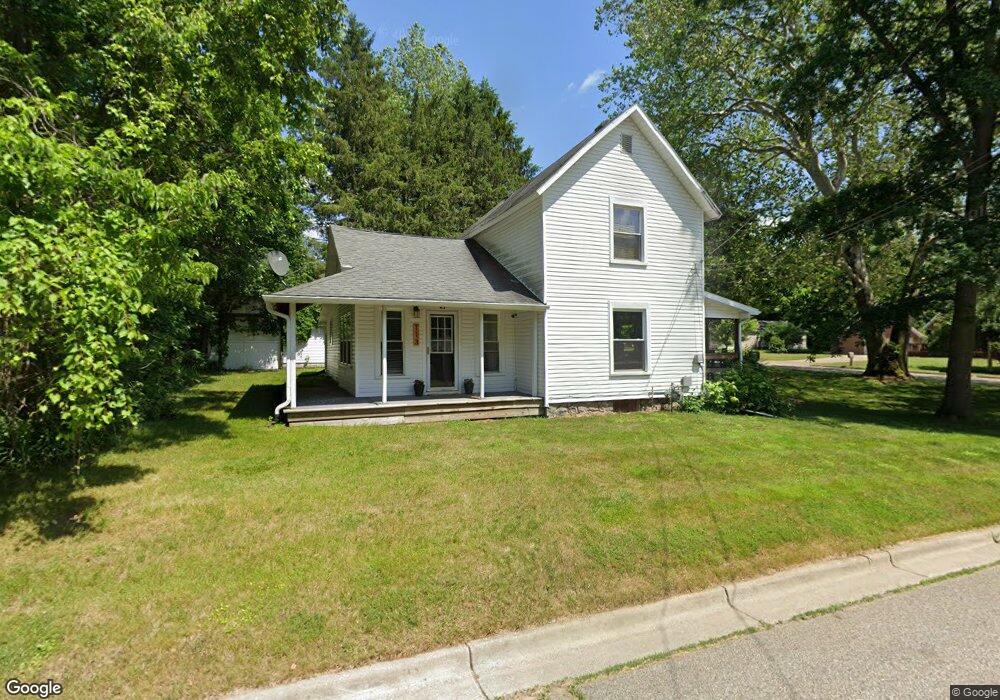
113 Charles St Allegan, MI 49010
Estimated Value: $202,000 - $225,000
4
Beds
1
Bath
1,396
Sq Ft
$154/Sq Ft
Est. Value
About This Home
This home is located at 113 Charles St, Allegan, MI 49010 and is currently estimated at $215,231, approximately $154 per square foot. 113 Charles St is a home located in Allegan County with nearby schools including North Ward Elementary School, L.E. White Middle School, and Allegan High School.
Ownership History
Date
Name
Owned For
Owner Type
Purchase Details
Closed on
Apr 30, 2021
Sold by
Richmond Nicole E
Bought by
Brinks Sarah
Current Estimated Value
Home Financials for this Owner
Home Financials are based on the most recent Mortgage that was taken out on this home.
Original Mortgage
$150,350
Outstanding Balance
$136,255
Interest Rate
3.1%
Mortgage Type
New Conventional
Estimated Equity
$78,976
Purchase Details
Closed on
Jul 20, 2009
Sold by
Mortgage Electronic Registration Systems
Bought by
Federal National Mortgage Association
Purchase Details
Closed on
Jul 16, 2009
Sold by
Blanchard Judy K
Bought by
Mortgage Electronic Registration Systems
Purchase Details
Closed on
Oct 16, 1990
Bought by
Blanchard
Create a Home Valuation Report for This Property
The Home Valuation Report is an in-depth analysis detailing your home's value as well as a comparison with similar homes in the area
Home Values in the Area
Average Home Value in this Area
Purchase History
| Date | Buyer | Sale Price | Title Company |
|---|---|---|---|
| Brinks Sarah | $155,000 | None Available | |
| Brinks Sarah | $155,000 | None Listed On Document | |
| Federal National Mortgage Association | -- | None Available | |
| Mortgage Electronic Registration Systems | $89,983 | None Available | |
| Blanchard | $28,000 | -- |
Source: Public Records
Mortgage History
| Date | Status | Borrower | Loan Amount |
|---|---|---|---|
| Open | Brinks Sarah | $150,350 | |
| Closed | Brinks Sarah | $150,350 |
Source: Public Records
Tax History Compared to Growth
Tax History
| Year | Tax Paid | Tax Assessment Tax Assessment Total Assessment is a certain percentage of the fair market value that is determined by local assessors to be the total taxable value of land and additions on the property. | Land | Improvement |
|---|---|---|---|---|
| 2025 | $3,176 | $90,400 | $29,800 | $60,600 |
| 2024 | $2,899 | $87,400 | $28,600 | $58,800 |
| 2023 | $2,995 | $76,000 | $26,800 | $49,200 |
| 2022 | $2,899 | $64,200 | $22,600 | $41,600 |
| 2021 | $1,264 | $58,100 | $17,900 | $40,200 |
| 2020 | $1,245 | $46,800 | $14,900 | $31,900 |
| 2019 | $1,215 | $39,400 | $11,700 | $27,700 |
| 2018 | $1,167 | $34,700 | $11,700 | $23,000 |
| 2017 | $0 | $31,400 | $10,000 | $21,400 |
| 2016 | $0 | $26,000 | $8,800 | $17,200 |
| 2015 | -- | $26,000 | $8,800 | $17,200 |
| 2014 | -- | $26,300 | $8,500 | $17,800 |
| 2013 | $1,214 | $26,800 | $8,500 | $18,300 |
Source: Public Records
Map
Nearby Homes