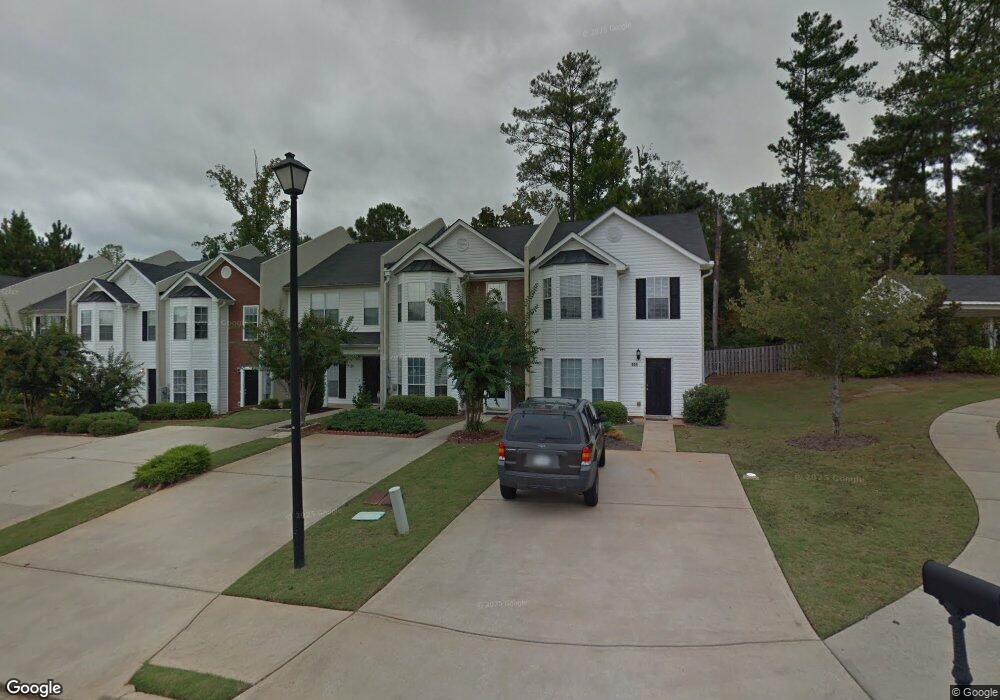
113 Chastain Loop Unit 113 Newnan, GA 30263
Estimated Value: $201,000 - $207,000
3
Beds
3
Baths
1,388
Sq Ft
$147/Sq Ft
Est. Value
About This Home
This home is located at 113 Chastain Loop Unit 113, Newnan, GA 30263 and is currently estimated at $204,039, approximately $147 per square foot. 113 Chastain Loop Unit 113 is a home located in Coweta County with nearby schools including White Oak Elementary School, Arnall Middle School, and East Coweta High School.
Ownership History
Date
Name
Owned For
Owner Type
Purchase Details
Closed on
Sep 27, 2013
Sold by
Falla Estela
Bought by
Falla Laureano
Current Estimated Value
Purchase Details
Closed on
Aug 17, 2011
Sold by
Bailey Andrea
Bought by
Falla Laureano and Falla Estela
Purchase Details
Closed on
May 19, 2003
Sold by
Meyer-Sutton Homes Inc
Bought by
Bailey Andrea
Home Financials for this Owner
Home Financials are based on the most recent Mortgage that was taken out on this home.
Original Mortgage
$105,050
Interest Rate
5.81%
Mortgage Type
FHA
Purchase Details
Closed on
Apr 27, 2003
Sold by
Chastain Park Communities Llc
Bought by
Meyer-Sutton Homes Inc
Home Financials for this Owner
Home Financials are based on the most recent Mortgage that was taken out on this home.
Original Mortgage
$105,050
Interest Rate
5.81%
Mortgage Type
FHA
Purchase Details
Closed on
Jan 26, 2001
Sold by
Southern Crescent Comm
Bought by
Chastain Park Communities Llc
Create a Home Valuation Report for This Property
The Home Valuation Report is an in-depth analysis detailing your home's value as well as a comparison with similar homes in the area
Home Values in the Area
Average Home Value in this Area
Purchase History
| Date | Buyer | Sale Price | Title Company |
|---|---|---|---|
| Falla Laureano | -- | -- | |
| Falla Laureano | $50,000 | -- | |
| Bailey Andrea | $105,900 | -- | |
| Meyer-Sutton Homes Inc | $1,611,600 | -- | |
| Chastain Park Communities Llc | -- | -- |
Source: Public Records
Mortgage History
| Date | Status | Borrower | Loan Amount |
|---|---|---|---|
| Previous Owner | Bailey Andrea | $105,050 |
Source: Public Records
Tax History Compared to Growth
Tax History
| Year | Tax Paid | Tax Assessment Tax Assessment Total Assessment is a certain percentage of the fair market value that is determined by local assessors to be the total taxable value of land and additions on the property. | Land | Improvement |
|---|---|---|---|---|
| 2024 | $1,799 | $78,743 | $20,000 | $58,743 |
| 2023 | $1,799 | $74,101 | $16,000 | $58,101 |
| 2022 | $1,561 | $64,176 | $16,000 | $48,176 |
| 2021 | $1,467 | $54,591 | $12,000 | $42,591 |
| 2020 | $1,314 | $47,826 | $12,000 | $35,826 |
| 2019 | $1,132 | $37,672 | $8,000 | $29,672 |
| 2018 | $1,138 | $37,672 | $8,000 | $29,672 |
| 2017 | $983 | $32,672 | $3,000 | $29,672 |
| 2016 | $871 | $28,927 | $3,000 | $25,927 |
| 2015 | $594 | $19,708 | $3,000 | $16,708 |
| 2014 | $537 | $19,708 | $3,000 | $16,708 |
Source: Public Records
Map
Nearby Homes
- 81 Chastain Cir
- 123 Chastain Cir
- 145 Greison Trail
- 139 Greison Trail
- 21 Umber Ln Unit LOT 24
- 22 Umber Ln Unit LOT 8
- 23 Umber Ln Unit LOT 23
- 19 Umber Ln Unit LOT 25
- 17 Umber Ln Unit LOT 26
- 8 Umber Ln Unit LOT 2
- 12 Umber Ln Unit LOT 4
- 40 Umber Ln Unit LOT 14
- 6 Umber Ln Unit LOT 1
- Springdale Plan at The Retreat at Brown's Ridge - The Retreat at Browns Ridge
- Boxwood Plan at The Retreat at Brown's Ridge - The Retreat at Browns Ridge
- Emory Plan at The Retreat at Brown's Ridge - The Retreat at Browns Ridge
- McIntosh Plan at The Retreat at Brown's Ridge - The Retreat at Browns Ridge
- Sullivan Plan at The Retreat at Brown's Ridge - The Retreat at Browns Ridge
- Bramblewood Plan at The Retreat at Brown's Ridge - The Retreat at Browns Ridge
- Waterford Plan at The Retreat at Brown's Ridge - The Retreat at Browns Ridge
- 113 Chastain Loop
- 115 Chastain Loop
- 111 Chastain Loop
- 119 Chastain Loop
- 121 Chastain Loop
- 123 Chastain Loop
- 0 Chastain Loop Unit 3160727
- 0 Chastain Loop Unit 8649493
- 0 Chastain Loop Unit 8668331
- 0 Chastain Loop Unit 8630627
- 0 Chastain Loop Unit 8685308
- 0 Chastain Loop Unit 8677231
- 0 Chastain Loop Unit 8622886
- 0 Chastain Loop Unit 8493476
- 0 Chastain Loop Unit 8475657
- 0 Chastain Loop Unit 8456391
- 0 Chastain Loop Unit 8340452
- 0 Chastain Loop Unit 8324768
- 0 Chastain Loop Unit 8108370
- 0 Chastain Loop Unit 8025503