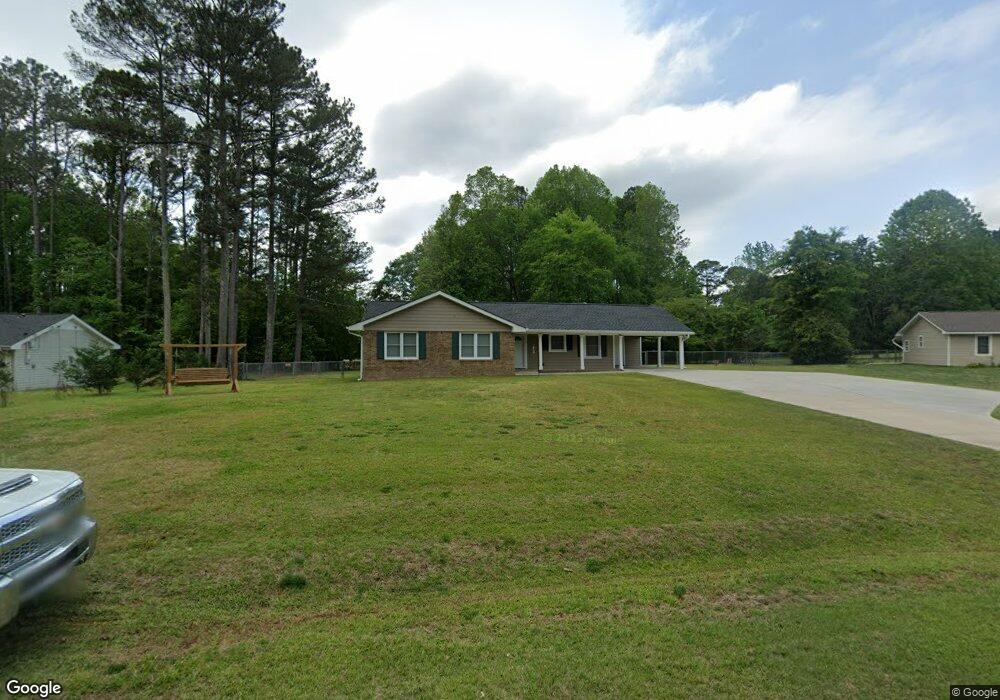
113 Clearwater Dr Lagrange, GA 30241
Estimated Value: $207,000 - $232,000
3
Beds
2
Baths
1,276
Sq Ft
$172/Sq Ft
Est. Value
About This Home
This home is located at 113 Clearwater Dr, Lagrange, GA 30241 and is currently estimated at $219,195, approximately $171 per square foot. 113 Clearwater Dr is a home located in Troup County with nearby schools including Callaway Elementary School, Hogansville Elementary School, and Callaway Middle School.
Ownership History
Date
Name
Owned For
Owner Type
Purchase Details
Closed on
Jan 12, 1995
Sold by
Knight Cheryl
Bought by
Whitlow Winston and Whitlow Judy
Current Estimated Value
Purchase Details
Closed on
Dec 27, 1988
Bought by
Knight Cheryl
Purchase Details
Closed on
Jul 23, 1982
Sold by
James Anthony Lowdenback
Purchase Details
Closed on
Aug 9, 1980
Sold by
Matheson Susan M and Matheson Michael C
Bought by
James Anthony Lowdenback
Purchase Details
Closed on
Mar 14, 1978
Sold by
Langford Holmes
Bought by
Matheson Susan M and Matheson Michael C
Purchase Details
Closed on
Jun 29, 1977
Sold by
Lsngford Const Co
Bought by
Langford Holmes
Purchase Details
Closed on
Jul 30, 1976
Sold by
Daniel Evans Dev Etal
Bought by
Lsngford Const Co
Purchase Details
Closed on
Oct 23, 1975
Bought by
Daniel Evans Dev Etal
Purchase Details
Closed on
Aug 4, 1975
Create a Home Valuation Report for This Property
The Home Valuation Report is an in-depth analysis detailing your home's value as well as a comparison with similar homes in the area
Purchase History
| Date | Buyer | Sale Price | Title Company |
|---|---|---|---|
| Whitlow Winston | $59,000 | -- | |
| Knight Cheryl | -- | -- | |
| -- | -- | -- | |
| James Anthony Lowdenback | -- | -- | |
| Matheson Susan M | -- | -- | |
| Langford Holmes | -- | -- | |
| Lsngford Const Co | -- | -- | |
| Daniel Evans Dev Etal | -- | -- | |
| -- | -- | -- |
Source: Public Records
Tax History
| Year | Tax Paid | Tax Assessment Tax Assessment Total Assessment is a certain percentage of the fair market value that is determined by local assessors to be the total taxable value of land and additions on the property. | Land | Improvement |
|---|---|---|---|---|
| 2025 | $1,701 | $65,440 | $10,000 | $55,440 |
| 2024 | $1,646 | $62,360 | $10,000 | $52,360 |
| 2023 | $1,710 | $64,680 | $10,000 | $54,680 |
| 2022 | $1,659 | $61,440 | $10,000 | $51,440 |
| 2021 | $1,366 | $47,280 | $8,000 | $39,280 |
| 2020 | $1,366 | $47,280 | $8,000 | $39,280 |
| 2019 | $899 | $31,804 | $4,800 | $27,004 |
| 2018 | $798 | $28,444 | $6,000 | $22,444 |
| 2017 | $798 | $28,444 | $6,000 | $22,444 |
| 2016 | $775 | $27,686 | $6,000 | $21,686 |
| 2015 | $777 | $27,686 | $6,000 | $21,686 |
| 2014 | $743 | $26,544 | $6,000 | $20,544 |
| 2013 | -- | $27,799 | $6,000 | $21,799 |
Source: Public Records
Map
Nearby Homes
- SMOKEMONT Smokemont Dr
- 10 Whitfield Rd
- 119 Sir Lancelot St
- 883 Hammett Rd
- 124 Woodridge Cir
- 789 Hammett Rd
- 300 Old Pond Rd
- 200 Freshwater Ct Unit 37
- 234 River Meadow Dr
- 202 Freshwater Ct Unit E36
- 202 Freshwater Ct
- 402 Sweetwood Ct Unit LOT 2
- 204 Freshwater Ct
- 206 Freshwater Ct Unit 34E
- 206 Freshwater Ct
- 200 River Meadow Dr
- 124 Shenandoah Ln
- 114 Shenandoah Ln
- 106 Shenandoah Ln Unit 26E
- 106 Shenandoah Ln
- 111 Clearwater Dr
- 115 Clearwater Dr
- 109 Clearwater Dr
- 117 Clearwater Dr
- 110 Clearwater Dr
- 108 Clearwater Dr
- 119 Clearwater Dr
- 107 Clearwater Dr
- 314 Sivell Rd
- 316 Sivell Rd
- 312 Sivell Rd
- 318 Sivell Rd
- 310 Sivell Rd
- 320 Sivell Rd
- 121 Clearwater Dr
- 106 Clearwater Dr
- 113 Beaver Run
- 105 Clearwater Dr
- 322 Sivell Rd
- 102 Hazel Way
Your Personal Tour Guide
Ask me questions while you tour the home.