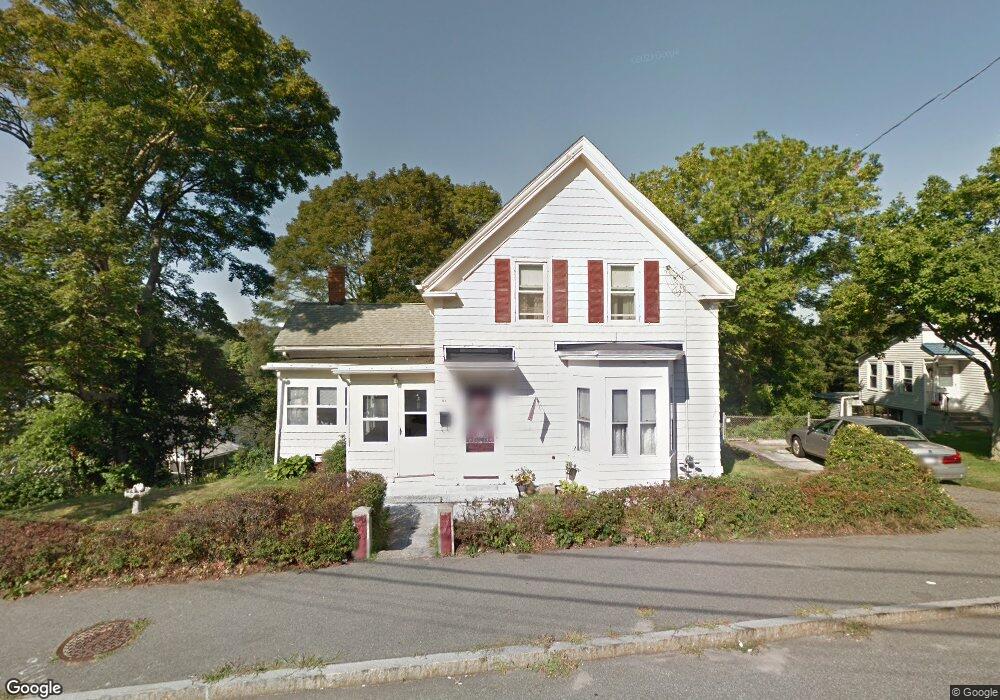
113 Common St Quincy, MA 02169
South Quincy NeighborhoodEstimated Value: $564,000 - $656,000
2
Beds
2
Baths
1,244
Sq Ft
$491/Sq Ft
Est. Value
About This Home
This home is located at 113 Common St, Quincy, MA 02169 and is currently estimated at $610,191, approximately $490 per square foot. 113 Common St is a home located in Norfolk County with nearby schools including South West Middle School, Lincoln-Hancock Community School, and Quincy High School.
Ownership History
Date
Name
Owned For
Owner Type
Purchase Details
Closed on
Oct 15, 2018
Sold by
Ryan Ann F
Bought by
Attridge John P
Current Estimated Value
Home Financials for this Owner
Home Financials are based on the most recent Mortgage that was taken out on this home.
Original Mortgage
$316,000
Outstanding Balance
$275,571
Interest Rate
4.5%
Mortgage Type
New Conventional
Estimated Equity
$334,620
Purchase Details
Closed on
Nov 16, 1971
Bought by
Ryan Richard F
Create a Home Valuation Report for This Property
The Home Valuation Report is an in-depth analysis detailing your home's value as well as a comparison with similar homes in the area
Home Values in the Area
Average Home Value in this Area
Purchase History
| Date | Buyer | Sale Price | Title Company |
|---|---|---|---|
| Attridge John P | $300,000 | -- | |
| Ryan Richard F | -- | -- |
Source: Public Records
Mortgage History
| Date | Status | Borrower | Loan Amount |
|---|---|---|---|
| Open | Attridge John P | $316,000 |
Source: Public Records
Tax History Compared to Growth
Tax History
| Year | Tax Paid | Tax Assessment Tax Assessment Total Assessment is a certain percentage of the fair market value that is determined by local assessors to be the total taxable value of land and additions on the property. | Land | Improvement |
|---|---|---|---|---|
| 2025 | $6,258 | $542,800 | $319,000 | $223,800 |
| 2024 | $5,958 | $528,700 | $304,200 | $224,500 |
| 2023 | $5,593 | $502,500 | $290,100 | $212,400 |
| 2022 | $5,344 | $446,100 | $233,400 | $212,700 |
| 2021 | $5,010 | $412,700 | $233,400 | $179,300 |
| 2020 | $4,979 | $400,600 | $233,400 | $167,200 |
| 2019 | $4,600 | $366,500 | $226,900 | $139,600 |
| 2018 | $4,770 | $357,600 | $210,600 | $147,000 |
| 2017 | $4,774 | $336,900 | $200,900 | $136,000 |
| 2016 | $4,454 | $310,200 | $183,300 | $126,900 |
| 2015 | $4,222 | $289,200 | $173,300 | $115,900 |
| 2014 | $4,147 | $279,100 | $173,300 | $105,800 |
Source: Public Records
Map
Nearby Homes
- 211 Copeland St
- 1 Cityview Ln Unit 506
- 1 Cityview Ln Unit 210
- 1 Cityview Ln Unit 709
- 1 Cityview Ln Unit 204
- 73 Connell St
- 25 Carrolls Ln
- 46 Suomi Rd
- 46 Suomi Rd Unit 46
- 10 White St
- 46-48 Buckley St
- 57 Buckley St
- 42 West St
- 14 Arthur Ave
- 89 Puritan Dr
- 12 Arthur Ave
- 21 Arthur St
- 510 Willard St
- 91 Garfield St
- 41 Wallace Rd
- 107 Common St
- 119 Common St
- 35 Barry St
- 105 Common St
- 41 Barry St
- 101 Common St
- 110 Common St
- 104 Common St
- 125 Common St Unit 4
- 125 Common St Unit 1
- 125 Common St Unit 6
- 125 Common St Unit 2
- 116 Common St
- 93 Common St
- 100 Common St
- 122 Common St
- 47 Barry St
- 32 Barry St
- 32 Barry St Unit 2
- 128 Common St