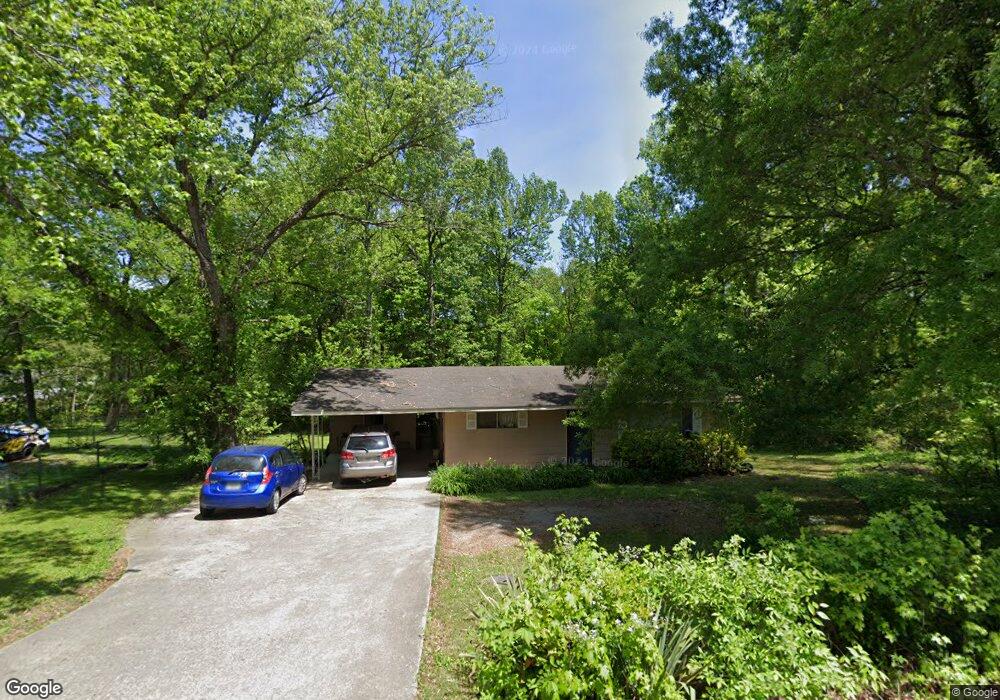
113 Corinth Rd La Fayette, GA 30728
Estimated Value: $109,000 - $166,000
2
Beds
1
Bath
950
Sq Ft
$148/Sq Ft
Est. Value
About This Home
This home is located at 113 Corinth Rd, La Fayette, GA 30728 and is currently estimated at $140,793, approximately $148 per square foot. 113 Corinth Rd is a home located in Walker County with nearby schools including Naomi Elementary School, Lafayette Middle School, and Lafayette High School.
Ownership History
Date
Name
Owned For
Owner Type
Purchase Details
Closed on
Aug 24, 2006
Sold by
Not Provided
Bought by
Jennings Katherine L
Current Estimated Value
Home Financials for this Owner
Home Financials are based on the most recent Mortgage that was taken out on this home.
Original Mortgage
$57,000
Outstanding Balance
$34,054
Interest Rate
6.67%
Mortgage Type
New Conventional
Estimated Equity
$106,739
Purchase Details
Closed on
May 11, 2001
Sold by
Watson Thomas D
Bought by
Everett Jason G and Everett Michelle
Purchase Details
Closed on
Sep 7, 2000
Sold by
Watson Thomas D and Lee Ann
Bought by
Watson Thomas D
Purchase Details
Closed on
Nov 10, 1992
Sold by
Pickard Rocky L and Pickard Wanda
Bought by
Watson Thomas D and Lee Ann
Purchase Details
Closed on
Jun 6, 1987
Sold by
Swafford H Paul
Bought by
Pickard Rocky L and Pickard Wanda
Purchase Details
Closed on
Nov 3, 1964
Bought by
Swafford H Paul
Create a Home Valuation Report for This Property
The Home Valuation Report is an in-depth analysis detailing your home's value as well as a comparison with similar homes in the area
Home Values in the Area
Average Home Value in this Area
Purchase History
| Date | Buyer | Sale Price | Title Company |
|---|---|---|---|
| Jennings Katherine L | $65,000 | -- | |
| Everett Jason G | $54,900 | -- | |
| Watson Thomas D | -- | -- | |
| Watson Thomas D | $35,500 | -- | |
| Pickard Rocky L | $19,000 | -- | |
| Swafford H Paul | -- | -- |
Source: Public Records
Mortgage History
| Date | Status | Borrower | Loan Amount |
|---|---|---|---|
| Open | Jennings Katherine L | $57,000 |
Source: Public Records
Tax History Compared to Growth
Tax History
| Year | Tax Paid | Tax Assessment Tax Assessment Total Assessment is a certain percentage of the fair market value that is determined by local assessors to be the total taxable value of land and additions on the property. | Land | Improvement |
|---|---|---|---|---|
| 2024 | $856 | $38,003 | $7,115 | $30,888 |
| 2023 | $808 | $34,988 | $5,647 | $29,341 |
| 2022 | $682 | $27,467 | $2,324 | $25,143 |
| 2021 | $497 | $17,842 | $2,324 | $15,518 |
| 2020 | $452 | $15,567 | $2,324 | $13,243 |
| 2019 | $459 | $15,567 | $2,324 | $13,243 |
| 2018 | $412 | $15,567 | $2,324 | $13,243 |
| 2017 | $503 | $15,567 | $2,324 | $13,243 |
| 2016 | $462 | $15,567 | $2,324 | $13,243 |
| 2015 | $667 | $22,620 | $3,776 | $18,844 |
| 2014 | $585 | $22,620 | $3,776 | $18,844 |
| 2013 | -- | $22,620 | $3,776 | $18,844 |
Source: Public Records
Map
Nearby Homes
- 2 Skyline Heights
- 154 Skyline Heights
- 140 Bryant Ave
- 78 Lake Terrace Dr
- 35 Sunset Dr
- 27 Foster
- 0 Crest Dr Unit 10628988
- 0 Crest Dr Unit 1522720
- 114 Clear Lake Dr
- 307 S Duke St
- 0 Farris St Unit 1512317
- 0 Farris St
- 21058 Georgia 193
- 7552 Us Highway 27
- 304 S Cherokee St
- E Armuchee Rd
- 0 Highway 27 S Unit 10644372
- 0 Cherokee Knoll Unit 1511608
- 0 Highway 27 S Unit 1524045
- 207 Culberson Ave
- 93 Corinth Rd
- 124 Corinth Rd
- 58 Corinth Rd
- 1040 E Villanow St
- 159 Corinth Rd
- 1014 E Villanow St
- 1054 E Villanow St
- 185 Corinth Rd
- 146 Corinth Rd
- 4 Corinth Rd
- 00 Corinth Rd
- 171 Corinth Rd
- 0 Corinth Rd Unit 1075511
- 0 Corinth Rd Unit 1061271
- 0 Corinth Rd Unit 1075510
- 0 Corinth Rd Unit 1061272
- 0 Corinth Rd Unit 1061240
- 0 Corinth Rd Unit 1075492
- 0 Corinth Rd Unit 1284886
- 0 Corinth Rd Unit 1274063