113 Craigie Ln Unit 15 Inverness, IL 60067
Estimated Value: $649,239 - $751,000
3
Beds
--
Bath
2,884
Sq Ft
$241/Sq Ft
Est. Value
About This Home
This home is located at 113 Craigie Ln Unit 15, Inverness, IL 60067 and is currently estimated at $696,310, approximately $241 per square foot. 113 Craigie Ln Unit 15 is a home located in Cook County with nearby schools including Thomas Jefferson Elementary School, Marion Jordan Elementary School, and Nielson Elementary School.
Ownership History
Date
Name
Owned For
Owner Type
Purchase Details
Closed on
Feb 21, 2015
Sold by
Stevens Marcia E
Bought by
Steven George W and Stevens Marcia E
Current Estimated Value
Purchase Details
Closed on
Nov 18, 1997
Sold by
Stevens George W and Stevens Marcia E
Bought by
Stevens Marcia E and Marcia E Stevens Declaration Of Trust
Create a Home Valuation Report for This Property
The Home Valuation Report is an in-depth analysis detailing your home's value as well as a comparison with similar homes in the area
Home Values in the Area
Average Home Value in this Area
Purchase History
| Date | Buyer | Sale Price | Title Company |
|---|---|---|---|
| Steven George W | -- | None Available | |
| Stevens Marcia E | -- | -- |
Source: Public Records
Tax History Compared to Growth
Tax History
| Year | Tax Paid | Tax Assessment Tax Assessment Total Assessment is a certain percentage of the fair market value that is determined by local assessors to be the total taxable value of land and additions on the property. | Land | Improvement |
|---|---|---|---|---|
| 2024 | $13,067 | $51,134 | $3,980 | $47,154 |
| 2023 | $12,692 | $51,134 | $3,980 | $47,154 |
| 2022 | $12,692 | $51,134 | $3,980 | $47,154 |
| 2021 | $12,379 | $45,335 | $2,653 | $42,682 |
| 2020 | $12,299 | $45,335 | $2,653 | $42,682 |
| 2019 | $12,215 | $50,434 | $2,653 | $47,781 |
| 2018 | $12,067 | $46,958 | $2,211 | $44,747 |
| 2017 | $11,861 | $46,958 | $2,211 | $44,747 |
| 2016 | $11,583 | $46,958 | $2,211 | $44,747 |
| 2015 | $10,304 | $39,494 | $1,768 | $37,726 |
| 2014 | $10,669 | $41,154 | $1,768 | $39,386 |
| 2013 | $10,324 | $41,154 | $1,768 | $39,386 |
Source: Public Records
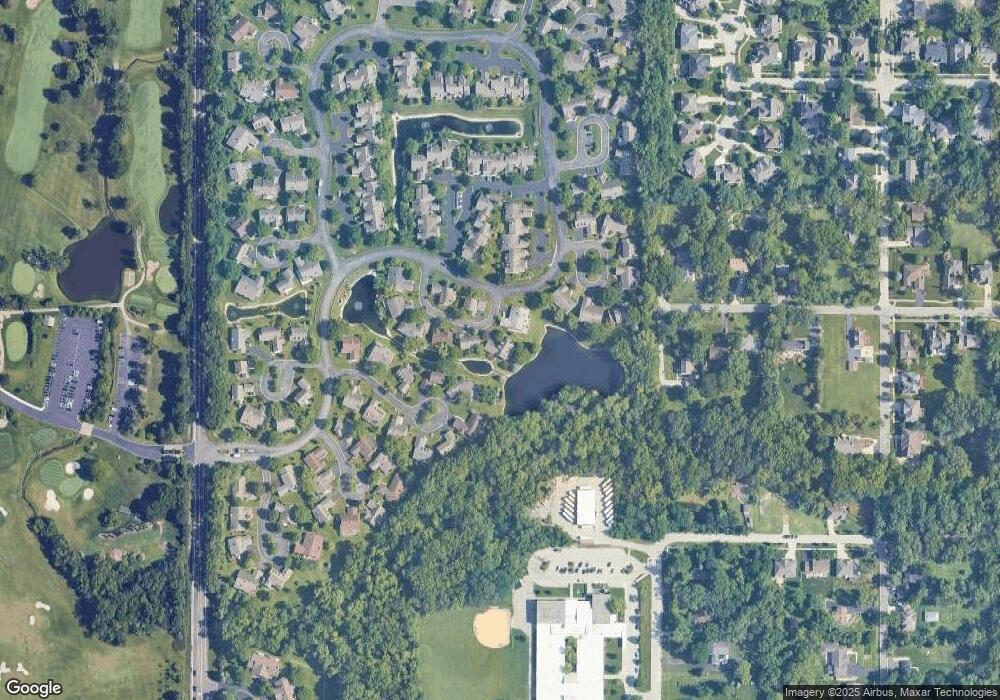
Map
Nearby Homes
- 130 Warkworth Ln Unit 83
- 105 Craigie Ln Unit 22
- 43 Ravenscraig Ln Unit 34
- 192 Glamis Ln Unit 131
- 558 Saint Andrews Ln
- 951 W Willow St
- 1596 W Palatine Rd
- 886 W Palatine Rd
- 77 N Quentin Rd Unit 414
- 1124 W Colfax St
- 667 N Morrison Ave
- 848 W Kenilworth Ave
- 550 N Quentin Rd
- 580 N Quentin Rd
- 1842 Thomas Atkinson Rd
- 839 W Brookside St
- 836 W Dorchester Rd
- 834 W Dorchester Rd
- 1224 W Whytecliff Rd
- 107 S Ash St
- 111 Craigie Ln Unit 47
- 115 Craigie Ln Unit 29
- 117 Craigie Ln Unit 6
- 85 Lochleven Ln Unit 11
- 109 Craigie Ln Unit 48
- 87 Lochleven Ln Unit 10
- 119 Craigie Ln Unit 33
- 125 Knockderry Ln Unit 78
- 81 Lochleven Ln Unit 7
- 107 Craigie Ln Unit 23
- 132 Warkworth Ln Unit 82
- 127 Knockderry Ln Unit 77
- 128 Kilchurn Ln Unit 84
- 89 Lochleven Ln Unit 9
- 126 Kilchurn Ln Unit 85
- 134 Warkworth Ln Unit 81
- 79 Lochleven Ln Unit 17
- 124 Kilchurn Ln Unit 86
- 91 Lochleven Ln Unit 8
- 103 Craigie Ln Unit 21