113 Daniel Ct Lagrange, GA 30241
Estimated Value: $202,000 - $227,000
3
Beds
2
Baths
1,520
Sq Ft
$141/Sq Ft
Est. Value
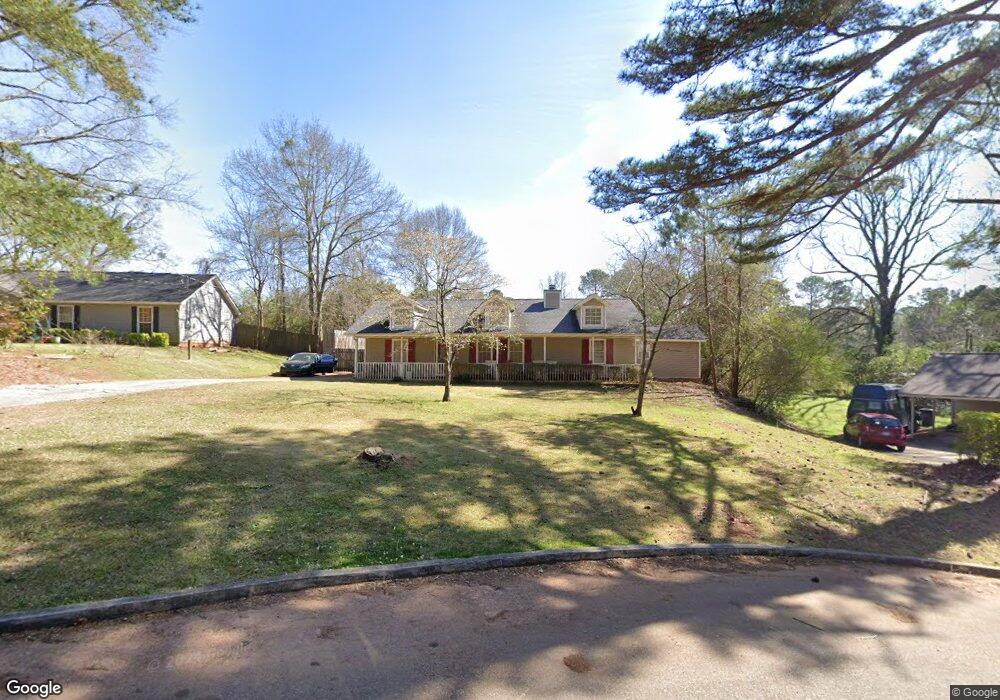
About This Home
This home is located at 113 Daniel Ct, Lagrange, GA 30241 and is currently estimated at $214,253, approximately $140 per square foot. 113 Daniel Ct is a home located in Troup County with nearby schools including Franklin Forest Elementary School, Hollis Hand Elementary School, and Ethel W. Kight Elementary School.
Ownership History
Date
Name
Owned For
Owner Type
Purchase Details
Closed on
Dec 30, 2021
Sold by
Fomby Enterprises Family Lp
Bought by
Brown Joyce E
Current Estimated Value
Home Financials for this Owner
Home Financials are based on the most recent Mortgage that was taken out on this home.
Original Mortgage
$152,192
Outstanding Balance
$139,283
Interest Rate
3.05%
Mortgage Type
FHA
Estimated Equity
$74,970
Purchase Details
Closed on
May 28, 2002
Sold by
William T Fomby
Bought by
Fomby Enterprises Family Llp
Purchase Details
Closed on
Jan 28, 1988
Sold by
First Federal
Bought by
William T Fomby
Purchase Details
Closed on
Sep 1, 1987
Sold by
Fuller John and Fuller Judith W
Bought by
First Federal
Purchase Details
Closed on
May 12, 1981
Sold by
Dan Ric Inc
Bought by
Fuller John and Fuller Judith W
Purchase Details
Closed on
Apr 16, 1981
Sold by
Allen Daniel
Bought by
Dan Ric Inc
Create a Home Valuation Report for This Property
The Home Valuation Report is an in-depth analysis detailing your home's value as well as a comparison with similar homes in the area
Purchase History
| Date | Buyer | Sale Price | Title Company |
|---|---|---|---|
| Brown Joyce E | $155,000 | -- | |
| Fomby Enterprises Family Llp | -- | -- | |
| William T Fomby | $47,000 | -- | |
| First Federal | -- | -- | |
| Fuller John | -- | -- | |
| Dan Ric Inc | -- | -- |
Source: Public Records
Mortgage History
| Date | Status | Borrower | Loan Amount |
|---|---|---|---|
| Open | Brown Joyce E | $152,192 |
Source: Public Records
Tax History
| Year | Tax Paid | Tax Assessment Tax Assessment Total Assessment is a certain percentage of the fair market value that is determined by local assessors to be the total taxable value of land and additions on the property. | Land | Improvement |
|---|---|---|---|---|
| 2025 | $2,021 | $74,096 | $10,000 | $64,096 |
| 2024 | $1,884 | $69,072 | $10,000 | $59,072 |
| 2023 | $1,721 | $63,096 | $10,000 | $53,096 |
| 2022 | $1,619 | $58,016 | $8,000 | $50,016 |
| 2021 | $1,151 | $40,160 | $8,000 | $32,160 |
| 2020 | $1,151 | $40,160 | $8,000 | $32,160 |
| 2019 | $1,057 | $37,040 | $6,000 | $31,040 |
| 2018 | $1,057 | $37,040 | $6,000 | $31,040 |
| 2017 | $1,057 | $37,040 | $6,000 | $31,040 |
| 2016 | $1,037 | $36,378 | $6,000 | $30,378 |
| 2015 | $1,006 | $35,266 | $6,000 | $29,266 |
| 2014 | $961 | $33,726 | $6,000 | $27,726 |
| 2013 | -- | $35,426 | $6,000 | $29,426 |
Source: Public Records
Map
Nearby Homes
- 114 Briarcliff Rd
- 134 S Page St
- 806 New Franklin Rd
- 204 Colonial St
- 110 Russell St
- 900 North St
- 202 Park Hill Dr
- 102 Dogwood Dr
- 204 Dixie Creek Dr
- 102 Beech Creek Dr
- 129 Celebration Blvd
- 517 Tradition Place
- 519 Tradition Place
- 106 Ewing St
- 210 Hearthstone Dr
- 203 Bonaventure Dr
- 732 Camellia Dr
- 724 Camellia Dr
- 109 Thomas St
- 112 Celebration Blvd
Your Personal Tour Guide
Ask me questions while you tour the home.