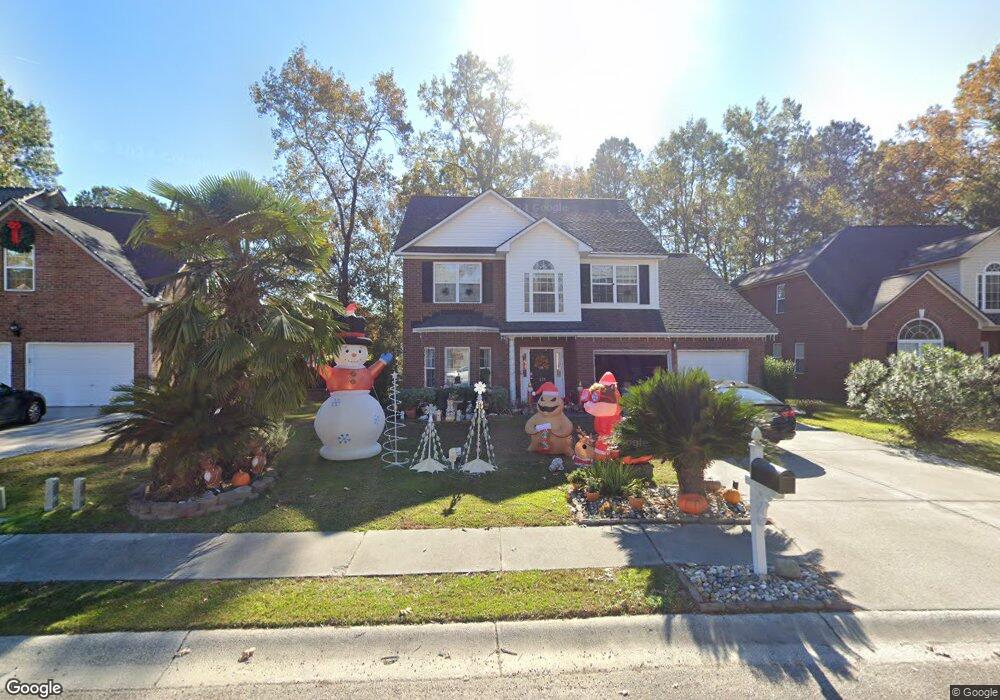
113 Dasharon Ln Goose Creek, SC 29445
Estimated Value: $444,170 - $502,000
--
Bed
--
Bath
2,118
Sq Ft
$228/Sq Ft
Est. Value
About This Home
This home is located at 113 Dasharon Ln, Goose Creek, SC 29445 and is currently estimated at $483,543, approximately $228 per square foot. 113 Dasharon Ln is a home located in Berkeley County with nearby schools including College Park Elementary School, College Park Middle School, and Stratford High School.
Ownership History
Date
Name
Owned For
Owner Type
Purchase Details
Closed on
Dec 21, 2018
Sold by
Schaefer Susan and Bojilov Susan S
Bought by
Schaefer Susan J
Current Estimated Value
Home Financials for this Owner
Home Financials are based on the most recent Mortgage that was taken out on this home.
Original Mortgage
$75,000
Outstanding Balance
$66,077
Interest Rate
4.8%
Mortgage Type
New Conventional
Estimated Equity
$417,466
Purchase Details
Closed on
Oct 18, 2006
Sold by
Vaughn Homes Inc
Bought by
Bojilov Blago and Bojilov Susan S
Home Financials for this Owner
Home Financials are based on the most recent Mortgage that was taken out on this home.
Original Mortgage
$150,000
Interest Rate
6.14%
Mortgage Type
New Conventional
Purchase Details
Closed on
Jul 28, 2006
Sold by
Vaughn Development Inc
Bought by
Vaughn Homes Inc
Create a Home Valuation Report for This Property
The Home Valuation Report is an in-depth analysis detailing your home's value as well as a comparison with similar homes in the area
Home Values in the Area
Average Home Value in this Area
Purchase History
| Date | Buyer | Sale Price | Title Company |
|---|---|---|---|
| Schaefer Susan J | $12,328 | None Available | |
| Bojilov Blago | $260,152 | None Available | |
| Vaughn Homes Inc | -- | None Available |
Source: Public Records
Mortgage History
| Date | Status | Borrower | Loan Amount |
|---|---|---|---|
| Open | Schaefer Susan J | $75,000 | |
| Previous Owner | Bojilov Blago | $150,000 |
Source: Public Records
Tax History Compared to Growth
Tax History
| Year | Tax Paid | Tax Assessment Tax Assessment Total Assessment is a certain percentage of the fair market value that is determined by local assessors to be the total taxable value of land and additions on the property. | Land | Improvement |
|---|---|---|---|---|
| 2025 | $1,613 | $317,170 | $112,445 | $204,725 |
| 2024 | $1,613 | $12,687 | $4,498 | $8,189 |
| 2023 | $1,613 | $12,687 | $4,061 | $8,626 |
| 2022 | $1,590 | $11,032 | $4,724 | $6,308 |
| 2021 | $1,724 | $11,030 | $4,724 | $6,308 |
| 2020 | $1,641 | $11,032 | $4,724 | $6,308 |
| 2019 | $1,579 | $11,032 | $4,724 | $6,308 |
| 2018 | $1,580 | $10,812 | $4,375 | $6,437 |
| 2017 | $1,567 | $10,812 | $4,375 | $6,437 |
| 2016 | $1,579 | $10,820 | $4,380 | $6,440 |
| 2015 | $1,478 | $10,820 | $4,380 | $6,440 |
| 2014 | $1,408 | $10,820 | $4,380 | $6,440 |
| 2013 | -- | $10,820 | $4,380 | $6,440 |
Source: Public Records
Map
Nearby Homes
- 102 David John Ct
- 1084 Wilhite Dr
- 103 Tunstall Dr
- 104 Chedburg Dr
- 1110 Wilhite Dr
- 108 Paige Ct
- 109 Waveney Cir
- 125 Eston Dr
- 697 Hamlet Cir
- 212 Hamlet Cir
- 100 Iken Cir
- 101 S Gateshead Crossing
- 100 N Gateshead Crossing
- 105 N Gateshead Crossing
- 101 N Warwick Trace
- 380 Furman Ln
- 109 S Norfolk Way
- 0 Acres Dr
- 102 Winding Rock Rd
- 100 Conset Bay Ct
- 115 Dasharon Ln
- 117 Dasharon Ln
- 109 Dasharon Ln
- 119 Dasharon Ln
- 122 Dasharon Ln
- 120 Dasharon Ln
- 124 Dasharon Ln
- 107 Dasharon Ln
- 118 Dasharon Ln
- 121 Dasharon Ln
- 105 Dasharon Ln
- 116 Dasharon Ln
- 104 David John Ct
- 114 Dasharon Ln
- 1058 Wilhite Dr
- 1064 Wilhite Dr
- 125 Dasharon Ln
- 1070 Wilhite Dr
- 100 David John Ct
- 1048 Wilhite Dr