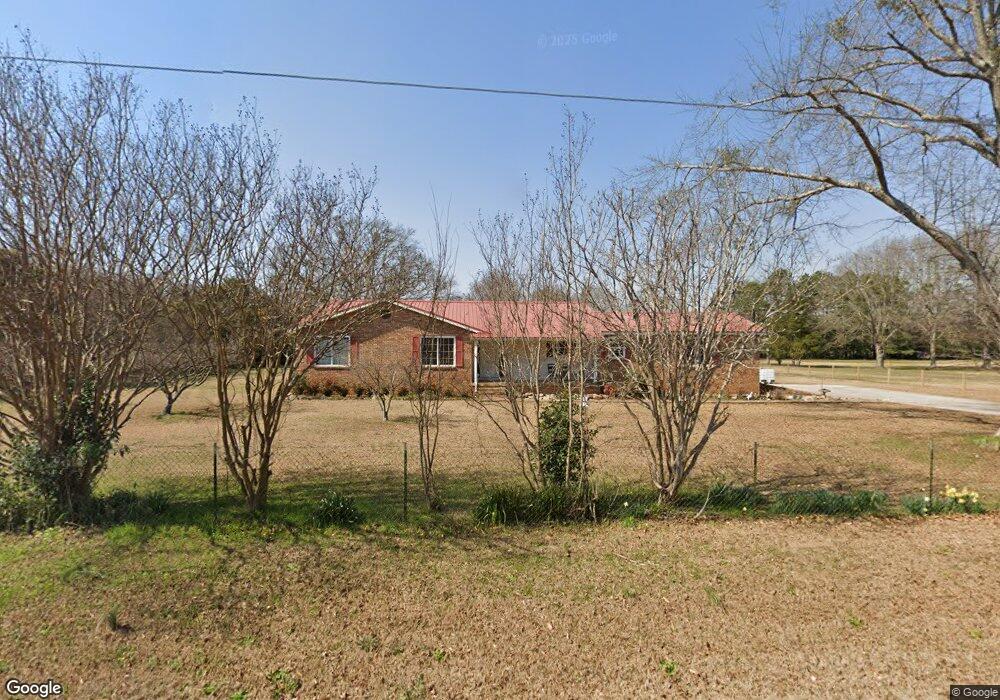
113 Deborah Dr Warner Robins, GA 31093
Estimated Value: $245,297 - $278,000
3
Beds
2
Baths
1,834
Sq Ft
$142/Sq Ft
Est. Value
About This Home
This home is located at 113 Deborah Dr, Warner Robins, GA 31093 and is currently estimated at $259,574, approximately $141 per square foot. 113 Deborah Dr is a home located in Houston County with nearby schools including Centerville Elementary School, Thomson Middle School, and Northside High School.
Ownership History
Date
Name
Owned For
Owner Type
Purchase Details
Closed on
Aug 26, 2024
Sold by
Pike Judy R and Pope Paula R
Bought by
Seacrist Douglas
Current Estimated Value
Home Financials for this Owner
Home Financials are based on the most recent Mortgage that was taken out on this home.
Original Mortgage
$210,800
Outstanding Balance
$207,462
Interest Rate
6.89%
Mortgage Type
New Conventional
Estimated Equity
$52,112
Purchase Details
Closed on
Feb 7, 2022
Sold by
Ridley Lois M
Bought by
Pike Judy R and Pope Paula R
Purchase Details
Closed on
Aug 27, 1976
Sold by
Mccarter Janice Seavy
Bought by
Ridley Paul H
Purchase Details
Closed on
Jul 3, 1976
Sold by
Seavy James Erhest
Bought by
Mccarter Janice Seavy
Purchase Details
Closed on
May 20, 1975
Sold by
Rountree Julian J
Bought by
Seavy James Erhest and Seavy Janice
Purchase Details
Closed on
Sep 21, 1973
Sold by
Wommack W A
Bought by
Rountree Julian J
Purchase Details
Closed on
Aug 2, 1972
Sold by
Spires David Lee
Bought by
Wommack W A
Purchase Details
Closed on
Dec 2, 1971
Sold by
Wommack W A
Bought by
Spires David Lee
Purchase Details
Closed on
Dec 20, 1968
Bought by
Wommack W A
Create a Home Valuation Report for This Property
The Home Valuation Report is an in-depth analysis detailing your home's value as well as a comparison with similar homes in the area
Home Values in the Area
Average Home Value in this Area
Purchase History
| Date | Buyer | Sale Price | Title Company |
|---|---|---|---|
| Seacrist Douglas | -- | None Listed On Document | |
| Pike Judy R | $25,000 | Varner & Peacock Llc | |
| Ridley Paul H | -- | -- | |
| Mccarter Janice Seavy | -- | -- | |
| Seavy James Erhest | -- | -- | |
| Rountree Julian J | -- | -- | |
| Wommack W A | -- | -- | |
| Spires David Lee | -- | -- | |
| Wommack W A | -- | -- |
Source: Public Records
Mortgage History
| Date | Status | Borrower | Loan Amount |
|---|---|---|---|
| Open | Seacrist Douglas | $210,800 |
Source: Public Records
Tax History
| Year | Tax Paid | Tax Assessment Tax Assessment Total Assessment is a certain percentage of the fair market value that is determined by local assessors to be the total taxable value of land and additions on the property. | Land | Improvement |
|---|---|---|---|---|
| 2025 | $1,885 | $93,096 | $13,960 | $79,136 |
| 2024 | $1,978 | $82,696 | $12,280 | $70,416 |
| 2023 | $1,615 | $66,816 | $9,600 | $57,216 |
| 2022 | $1,268 | $61,536 | $9,600 | $51,936 |
| 2021 | $1,129 | $55,560 | $9,600 | $45,960 |
| 2020 | $992 | $49,720 | $9,600 | $40,120 |
| 2019 | $992 | $49,720 | $9,600 | $40,120 |
| 2018 | $992 | $49,720 | $9,600 | $40,120 |
| 2017 | $993 | $49,720 | $9,600 | $40,120 |
| 2016 | $994 | $49,720 | $9,600 | $40,120 |
| 2015 | $994 | $49,720 | $9,600 | $40,120 |
| 2014 | -- | $49,720 | $9,600 | $40,120 |
| 2013 | -- | $47,960 | $9,600 | $38,360 |
Source: Public Records
Map
Nearby Homes
- 101 Kent Dr
- 207 Cambridge Dr
- 104 Sourwood Ln
- 118 Ridgewood Dr
- 119 Sourwood Ln
- 918 Collins Ave Unit 36
- 204 S Cambridge Dr
- 222 Ridgewood Dr
- 305 Brantley Rd Unit 14
- 305 Brantley Rd Unit 37
- 305 Brantley Rd Unit 6
- 109 Calvin Ct
- 400 S Cambridge Dr
- 111 Shamrock Dr
- 175 Arbor Creek
- 306 Thomson St
- 123 Logan's Mill Trail
- 210 Webb St
- 708 N Houston Lake Blvd
- 108 Weaver Rd
- 111 Deborah Dr
- 116 Deborah Dr
- 117 Deborah Dr
- 109 Deborah Dr
- 114 Deborah Dr
- 102 William Dr
- 119 Deborah Dr
- 105 William Dr
- 1004 N Houston Lake Blvd
- 107 William Dr
- 121 Deborah Dr
- 104 William Dr
- 1012 N Houston Lake Blvd
- N N Houston Lake Blvd
- 1013 N Houston Lake Blvd
- 1015 N Houston Lake Blvd
- 1017 N Houston Lake Blvd
- 1014 N Houston Lake Blvd
- 104 Deborah Dr
- 228 Sunnymeade Dr
Your Personal Tour Guide
Ask me questions while you tour the home.