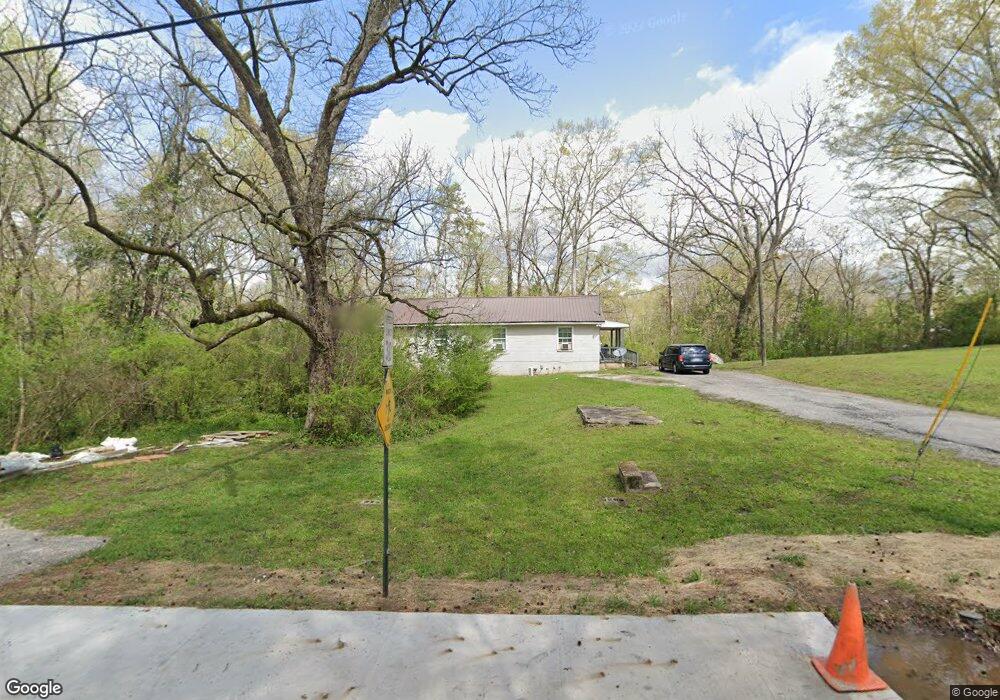
113 Deming St Lagrange, GA 30241
Estimated Value: $75,378 - $176,000
4
Beds
4
Baths
1,316
Sq Ft
$87/Sq Ft
Est. Value
About This Home
This home is located at 113 Deming St, Lagrange, GA 30241 and is currently estimated at $114,345, approximately $86 per square foot. 113 Deming St is a home with nearby schools including Callaway Elementary School, Hogansville Elementary School, and Callaway Middle School.
Ownership History
Date
Name
Owned For
Owner Type
Purchase Details
Closed on
Jan 6, 2023
Sold by
S & S Lagrange Llc
Bought by
Galvez Nixon E Recinos
Current Estimated Value
Purchase Details
Closed on
Jul 3, 2007
Sold by
Stribling Ty
Bought by
S S Lagrange Llc
Purchase Details
Closed on
Oct 13, 2003
Sold by
Martin J Miller
Bought by
Ty Stribling
Purchase Details
Closed on
May 22, 1997
Sold by
Phillip Stribling Etal
Bought by
Martin J Miller
Purchase Details
Closed on
Jan 18, 1994
Sold by
Melinda H Miller
Bought by
Phillip Stribling Etal
Purchase Details
Closed on
Jun 11, 1993
Sold by
Phillip E Stribling
Bought by
Melinda H Miller
Purchase Details
Closed on
Jan 1, 1983
Sold by
Goodwin W B
Bought by
Phillip E Stribling
Purchase Details
Closed on
Jan 1, 1966
Sold by
Goodwin J H
Bought by
Goodwin W B
Create a Home Valuation Report for This Property
The Home Valuation Report is an in-depth analysis detailing your home's value as well as a comparison with similar homes in the area
Purchase History
| Date | Buyer | Sale Price | Title Company |
|---|---|---|---|
| Galvez Nixon E Recinos | $40,000 | -- | |
| S S Lagrange Llc | $6,000 | -- | |
| Ty Stribling | $1,181,000 | -- | |
| Martin J Miller | -- | -- | |
| Phillip Stribling Etal | -- | -- | |
| Melinda H Miller | $237,000 | -- | |
| Phillip E Stribling | $3,500 | -- | |
| Goodwin W B | -- | -- |
Source: Public Records
Tax History
| Year | Tax Paid | Tax Assessment Tax Assessment Total Assessment is a certain percentage of the fair market value that is determined by local assessors to be the total taxable value of land and additions on the property. | Land | Improvement |
|---|---|---|---|---|
| 2025 | $540 | $19,800 | $3,000 | $16,800 |
| 2024 | $393 | $19,000 | $3,000 | $16,000 |
| 2023 | $733 | $26,880 | $3,000 | $23,880 |
| 2022 | $716 | $25,640 | $3,000 | $22,640 |
| 2021 | $291 | $9,640 | $1,000 | $8,640 |
| 2020 | $291 | $9,640 | $1,000 | $8,640 |
| 2019 | $312 | $10,360 | $800 | $9,560 |
| 2018 | $312 | $10,360 | $800 | $9,560 |
| 2017 | $312 | $10,360 | $800 | $9,560 |
| 2016 | $306 | $10,148 | $750 | $9,398 |
| 2015 | $307 | $10,148 | $750 | $9,398 |
| 2014 | $313 | $10,354 | $1,000 | $9,354 |
| 2013 | -- | $10,955 | $1,000 | $9,955 |
Source: Public Records
Map
Nearby Homes
- 109 Bell St
- 103 Cedar St
- 901 Whiteline St
- 0 E Fendig St
- 113 E Fendig St
- 101 Cedar St
- 0 Boggs St Unit 10550243
- 0 Boggs St Unit 10550231
- 0 Boggs St Unit 10550239
- 0 Boggs St Unit 10550250
- 112 Cedar St
- 0 Bagley St
- 304 Butler St
- 303 E Mulberry St
- 501 Milam St
- 203 Fannin St
- 200 Mccall St
- 1191 Whitesville St
- 0 Brown St Unit 10550761
- 0 Brown St Unit 10550754
- 124 E Crovat St
- 122 E Crovat St
- 200 E Crovat St
- 120 E Crovat St
- 202 E Crovat St
- 111 Fendig St
- 118 E Crovat St
- 204 E Crovat St
- E E Crovat St
- 196 Fendig St
- 109 Fendig St
- 209 Fendig St
- 116 E Crovat St
- 112 Fendig St
- 112 Fendig St
- 200 Fendig St
- 121 E Crovat St
- 114 E Crovat St
- 206 E Crovat St
- 206 1/2 E Crovat St
Your Personal Tour Guide
Ask me questions while you tour the home.