Estimated Value: $389,000 - $400,951
5
Beds
2
Baths
1,032
Sq Ft
$381/Sq Ft
Est. Value
About This Home
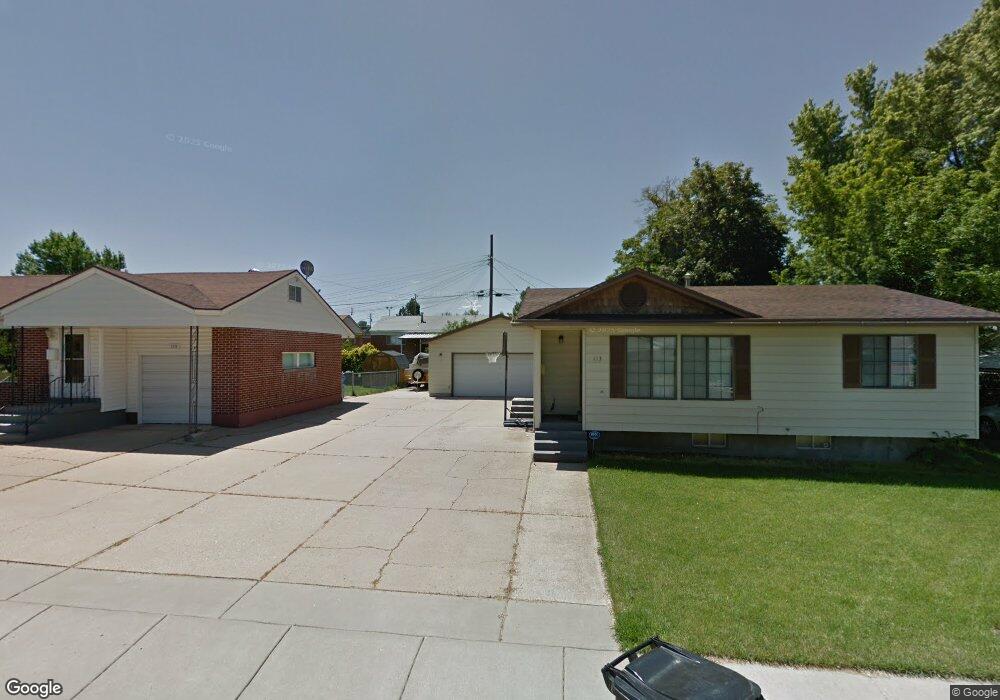
This home is located at 113 E 4775 S, Ogden, UT 84405 and is currently estimated at $393,488, approximately $381 per square foot. 113 E 4775 S is a home located in Weber County with nearby schools including Washington Terrace School, T.H. Bell Junior High School, and Bonneville High School.
Ownership History
Date
Name
Owned For
Owner Type
Purchase Details
Closed on
Apr 10, 2014
Sold by
Chipp William Mark and Chipp Wendy Nadine
Bought by
Dittmer Christopher and Dittmer Kami
Current Estimated Value
Home Financials for this Owner
Home Financials are based on the most recent Mortgage that was taken out on this home.
Original Mortgage
$4,050
Outstanding Balance
$1,157
Interest Rate
3.31%
Mortgage Type
Stand Alone Second
Estimated Equity
$392,331
Purchase Details
Closed on
Nov 20, 2008
Sold by
Vlaanderen Kathy R
Bought by
Chipp William Mark and Chipp Wendy Nadine
Home Financials for this Owner
Home Financials are based on the most recent Mortgage that was taken out on this home.
Original Mortgage
$90,000
Interest Rate
5.9%
Mortgage Type
Seller Take Back
Purchase Details
Closed on
Jan 9, 2007
Sold by
Vlaanderen Kathy R
Bought by
Vlaanderen Kathy R
Create a Home Valuation Report for This Property
The Home Valuation Report is an in-depth analysis detailing your home's value as well as a comparison with similar homes in the area
Home Values in the Area
Average Home Value in this Area
Purchase History
| Date | Buyer | Sale Price | Title Company |
|---|---|---|---|
| Dittmer Christopher | -- | Cornerstone Title Ins Agenc | |
| Chipp William Mark | -- | Backman Fptp | |
| Chipp William Mark | -- | Backman Fptp | |
| Vlaanderen Kathy R | -- | None Available |
Source: Public Records
Mortgage History
| Date | Status | Borrower | Loan Amount |
|---|---|---|---|
| Open | Dittmer Christopher | $4,050 | |
| Open | Dittmer Christopher | $132,554 | |
| Previous Owner | Chipp William Mark | $90,000 |
Source: Public Records
Tax History
| Year | Tax Paid | Tax Assessment Tax Assessment Total Assessment is a certain percentage of the fair market value that is determined by local assessors to be the total taxable value of land and additions on the property. | Land | Improvement |
|---|---|---|---|---|
| 2025 | $2,557 | $378,965 | $107,501 | $271,464 |
| 2024 | $2,423 | $201,848 | $59,125 | $142,723 |
| 2023 | $2,139 | $175,449 | $59,557 | $115,892 |
| 2022 | $2,366 | $204,050 | $56,893 | $147,157 |
| 2021 | $2,052 | $289,000 | $53,731 | $235,269 |
| 2020 | $1,982 | $255,000 | $44,011 | $210,989 |
| 2019 | $1,903 | $225,998 | $44,011 | $181,987 |
| 2018 | $1,717 | $199,000 | $44,011 | $154,989 |
| 2017 | $1,511 | $161,001 | $29,020 | $131,981 |
| 2016 | $1,504 | $88,298 | $16,232 | $72,066 |
| 2015 | $1,528 | $88,298 | $16,232 | $72,066 |
| 2014 | $1,246 | $68,580 | $16,232 | $52,348 |
Source: Public Records
Map
Nearby Homes
Your Personal Tour Guide
Ask me questions while you tour the home.