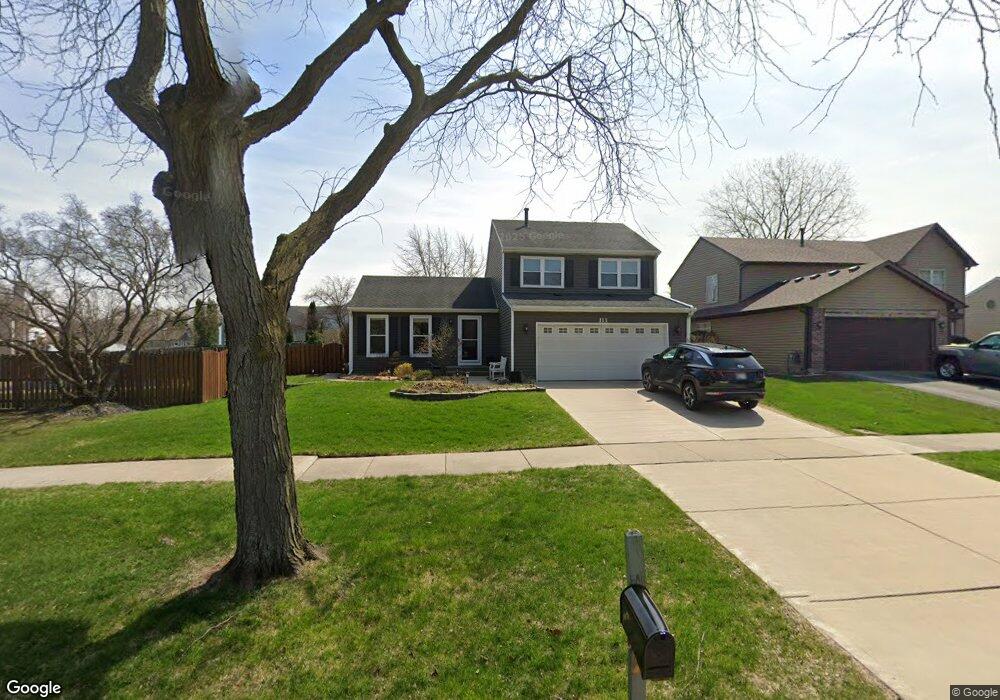
113 E 60th St Westmont, IL 60559
South Westmont NeighborhoodEstimated Value: $524,000 - $601,000
4
Beds
3
Baths
2,128
Sq Ft
$261/Sq Ft
Est. Value
About This Home
This home is located at 113 E 60th St, Westmont, IL 60559 and is currently estimated at $554,484, approximately $260 per square foot. 113 E 60th St is a home located in DuPage County with nearby schools including Holmes Elementary School, Maercker Elementary School, and Westview Hills Middle School.
Ownership History
Date
Name
Owned For
Owner Type
Purchase Details
Closed on
Aug 10, 2020
Sold by
Chicago Title Land Trust Company
Bought by
First Midwest Bank and Trust No 7773
Current Estimated Value
Purchase Details
Closed on
Aug 31, 2017
Sold by
Depaolo Mickey
Bought by
Chicago Title Land Trust Co and Trust No 8002360522
Home Financials for this Owner
Home Financials are based on the most recent Mortgage that was taken out on this home.
Original Mortgage
$292,000
Interest Rate
3.92%
Mortgage Type
New Conventional
Purchase Details
Closed on
Aug 18, 2017
Sold by
Rendon Gilbert J and Rendon Peggy S
Bought by
Depaold Mickey
Home Financials for this Owner
Home Financials are based on the most recent Mortgage that was taken out on this home.
Original Mortgage
$292,000
Interest Rate
3.92%
Mortgage Type
New Conventional
Create a Home Valuation Report for This Property
The Home Valuation Report is an in-depth analysis detailing your home's value as well as a comparison with similar homes in the area
Home Values in the Area
Average Home Value in this Area
Purchase History
| Date | Buyer | Sale Price | Title Company |
|---|---|---|---|
| First Midwest Bank | $389,000 | Chicago Title Land Trust Co | |
| Chicago Title Land Trust Co | -- | Chicago Title Land Trust Com | |
| Depaold Mickey | $365,000 | First American Title |
Source: Public Records
Mortgage History
| Date | Status | Borrower | Loan Amount |
|---|---|---|---|
| Previous Owner | Depaold Mickey | $292,000 |
Source: Public Records
Tax History Compared to Growth
Tax History
| Year | Tax Paid | Tax Assessment Tax Assessment Total Assessment is a certain percentage of the fair market value that is determined by local assessors to be the total taxable value of land and additions on the property. | Land | Improvement |
|---|---|---|---|---|
| 2024 | $8,922 | $145,841 | $40,009 | $105,832 |
| 2023 | $8,528 | $134,070 | $36,780 | $97,290 |
| 2022 | $8,196 | $128,170 | $35,160 | $93,010 |
| 2021 | $7,916 | $126,710 | $34,760 | $91,950 |
| 2020 | $7,748 | $124,200 | $34,070 | $90,130 |
| 2019 | $7,490 | $119,170 | $32,690 | $86,480 |
| 2018 | $6,617 | $106,060 | $38,350 | $67,710 |
| 2017 | $5,950 | $102,060 | $36,900 | $65,160 |
| 2016 | $5,811 | $97,020 | $35,180 | $61,840 |
| 2015 | $5,713 | $91,280 | $33,100 | $58,180 |
| 2014 | $6,000 | $95,040 | $32,180 | $62,860 |
| 2013 | $5,815 | $94,600 | $32,030 | $62,570 |
Source: Public Records
Map
Nearby Homes
- 263 Deming Place
- 1017 Fordham Way
- 1040 Longford Ct
- 12 James Dr
- 1205 Charleston Ct Unit 1205
- 511 S Cass Ave
- 6234 Western Ave
- 500 S Wilmette Ave
- 223 E 56th St
- 245 Carlisle Ave
- 428 S Warwick Ave
- 55 W 64th St Unit 202
- 107 65th Lake Dr Unit 202
- 67 W 64th St Unit 101
- 55 W 64th St Unit 102
- 1313 Cass Ln E Unit 301
- 47 W Pier Dr Unit 102
- 6039 Bentley Ave
- 47 E 55th St
- 61 Pier Dr Unit 202
- 109 E 60th St
- 197 Deming Place
- 117 Heath Place
- 105 E 60th St
- 201 Deming Place
- 121 Heath Place
- 109 Heath Place
- 113 Heath Place
- 136 E 60th St
- 110 E 60th St
- 105 Heath Place
- 101 Heath Place
- 205 Deming Place
- 106 E 60th St
- 125 Heath Place
- 209 Deming Place
- 828 S Wilmette Ave
- 200 Deming Place
- 129 Heath Place
- 833 Heath Ln