Estimated Value: $145,231 - $164,000
3
Beds
2
Baths
1,288
Sq Ft
$118/Sq Ft
Est. Value
About This Home
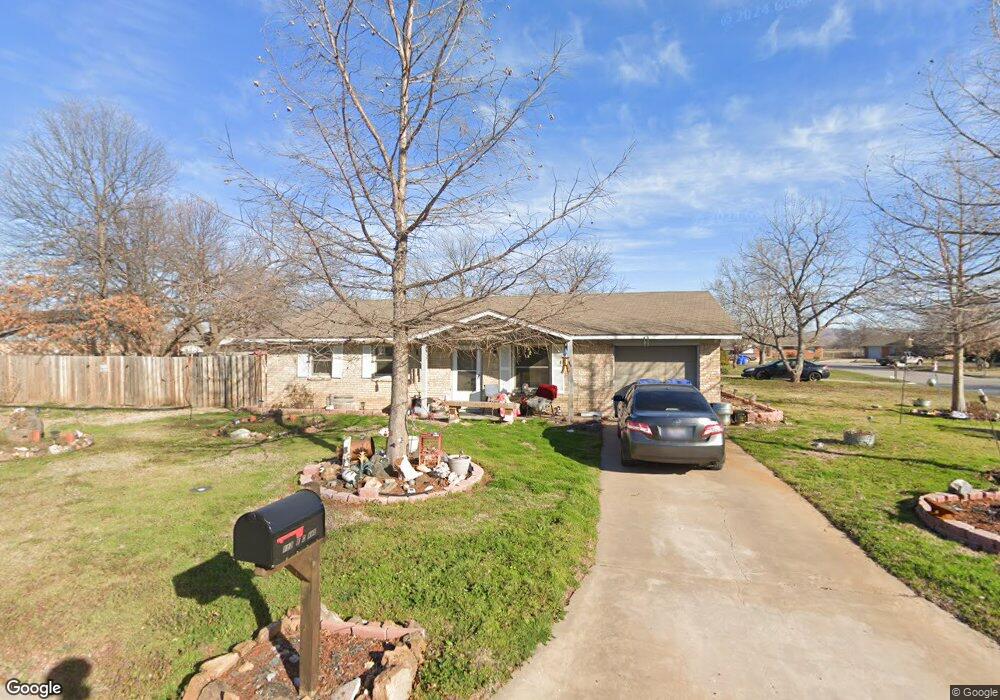
This home is located at 113 E C Ave, Cache, OK 73527 and is currently estimated at $152,308, approximately $118 per square foot. 113 E C Ave is a home located in Comanche County with nearby schools including Cache Primary Elementary School, Cache Intermediate Elementary School, and Cache Middle School.
Ownership History
Date
Name
Owned For
Owner Type
Purchase Details
Closed on
May 28, 2010
Sold by
Burke Jake A and Burke Violet M
Bought by
Jones Donna S
Current Estimated Value
Home Financials for this Owner
Home Financials are based on the most recent Mortgage that was taken out on this home.
Original Mortgage
$83,870
Outstanding Balance
$56,077
Interest Rate
5%
Mortgage Type
FHA
Estimated Equity
$96,231
Purchase Details
Closed on
Feb 15, 2008
Sold by
Burk Richard A and Burk Richard Allen
Bought by
Burk Jake A and Burk Violet M
Purchase Details
Closed on
Jul 15, 2004
Sold by
Pennington Aaron L and Pennington Jamie M
Create a Home Valuation Report for This Property
The Home Valuation Report is an in-depth analysis detailing your home's value as well as a comparison with similar homes in the area
Home Values in the Area
Average Home Value in this Area
Purchase History
| Date | Buyer | Sale Price | Title Company |
|---|---|---|---|
| Jones Donna S | $85,000 | -- | |
| Burk Jake A | -- | -- | |
| -- | $47,000 | -- |
Source: Public Records
Mortgage History
| Date | Status | Borrower | Loan Amount |
|---|---|---|---|
| Open | Jones Donna S | $83,870 |
Source: Public Records
Tax History
| Year | Tax Paid | Tax Assessment Tax Assessment Total Assessment is a certain percentage of the fair market value that is determined by local assessors to be the total taxable value of land and additions on the property. | Land | Improvement |
|---|---|---|---|---|
| 2025 | $1,109 | $10,425 | $1,280 | $9,145 |
| 2024 | $1,071 | $10,424 | $1,612 | $8,812 |
| 2023 | $1,071 | $9,456 | $844 | $8,612 |
| 2022 | $1,064 | $9,456 | $844 | $8,612 |
| 2021 | $866 | $9,297 | $844 | $8,453 |
| 2020 | $898 | $8,854 | $844 | $8,010 |
| 2019 | $903 | $8,854 | $844 | $8,010 |
| 2018 | $962 | $9,319 | $844 | $8,475 |
| 2017 | $990 | $9,909 | $844 | $9,065 |
| 2016 | $926 | $9,437 | $844 | $8,593 |
| 2015 | $880 | $8,988 | $844 | $8,144 |
| 2014 | $827 | $8,560 | $844 | $7,716 |
Source: Public Records
Map
Nearby Homes
- 209 E B Ave
- 207 C Ave
- 405 N Mountain Meadow Dr
- 207 & 1/2 N Crater Creek Rd
- 414 NW Granite Ave
- 433 NE Creekside Dr
- 817 Hummingbird Dr
- 201 NW Cherry Ave
- 627 NW Granite Ave
- 703 SW 6th
- 815 W D Ave
- 104 Parkview Cir
- 406 Shady Ln
- 17168 W Gore Blvd
- 303 Woodland Cir
- 168 SW Crater Creek Rd
- TBD Rock Creek Estate
- 1802 SW Paint Rd
- 21639 NW Holsey Acres Rd
- 587 Spring Creek Rd
Your Personal Tour Guide
Ask me questions while you tour the home.