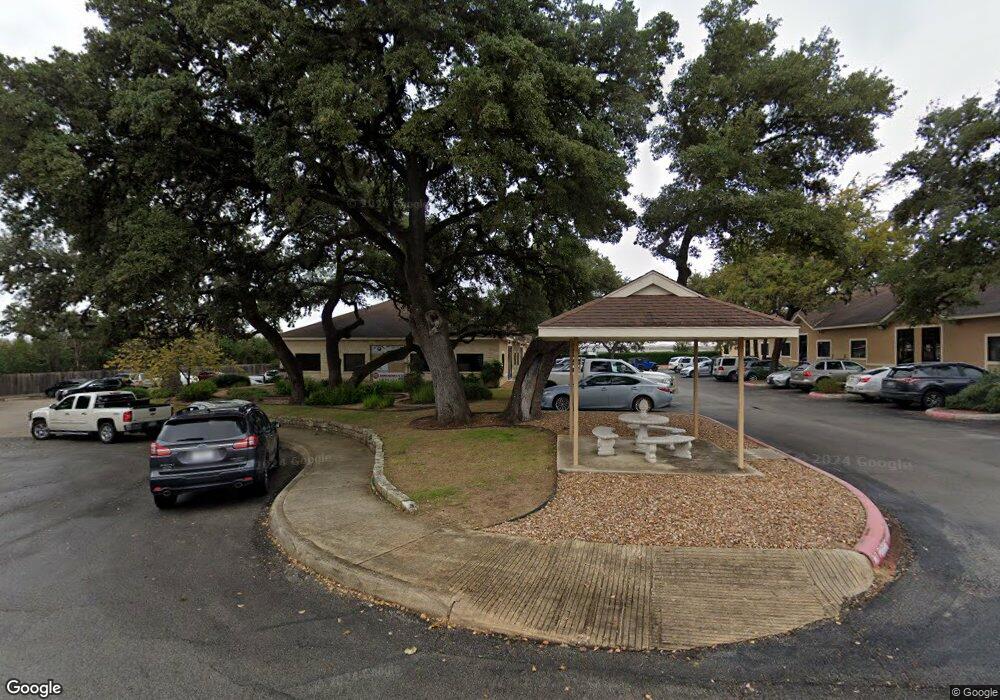
113 Falls Ct Unit 400 Boerne, TX 78006
Estimated Value: $425,847
--
Bed
1
Bath
1,250
Sq Ft
$341/Sq Ft
Est. Value
About This Home
This home is located at 113 Falls Ct Unit 400, Boerne, TX 78006 and is currently estimated at $425,847, approximately $340 per square foot. 113 Falls Ct Unit 400 is a home located in Kendall County with nearby schools including Kendall Elementary School, Boerne Middle School South, and Samuel V. Champion High School.
Ownership History
Date
Name
Owned For
Owner Type
Purchase Details
Closed on
May 31, 2017
Sold by
Zarma One Llc
Bought by
Dngfc Llc
Current Estimated Value
Purchase Details
Closed on
Apr 7, 2006
Sold by
T D Terry Properties Ltd
Bought by
Zarma One Llc
Home Financials for this Owner
Home Financials are based on the most recent Mortgage that was taken out on this home.
Original Mortgage
$128,062
Interest Rate
6.22%
Mortgage Type
Commercial
Create a Home Valuation Report for This Property
The Home Valuation Report is an in-depth analysis detailing your home's value as well as a comparison with similar homes in the area
Home Values in the Area
Average Home Value in this Area
Purchase History
| Date | Buyer | Sale Price | Title Company |
|---|---|---|---|
| Dngfc Llc | -- | None Available | |
| Zarma One Llc | -- | -- |
Source: Public Records
Mortgage History
| Date | Status | Borrower | Loan Amount |
|---|---|---|---|
| Previous Owner | Zarma One Llc | $128,062 |
Source: Public Records
Tax History Compared to Growth
Tax History
| Year | Tax Paid | Tax Assessment Tax Assessment Total Assessment is a certain percentage of the fair market value that is determined by local assessors to be the total taxable value of land and additions on the property. | Land | Improvement |
|---|---|---|---|---|
| 2025 | $5,280 | $285,360 | $83,850 | $201,510 |
| 2024 | $5,280 | $285,360 | $83,850 | $201,510 |
| 2023 | $5,301 | $285,360 | $83,850 | $201,510 |
| 2022 | $5,087 | $251,560 | $139,610 | $111,950 |
| 2021 | $4,391 | $205,020 | $93,070 | $111,950 |
| 2020 | $4,457 | $205,020 | $93,070 | $111,950 |
| 2019 | $4,600 | $205,020 | $93,070 | $111,950 |
| 2018 | $4,600 | $205,020 | $93,070 | $111,950 |
| 2017 | $4,522 | $205,020 | $93,070 | $111,950 |
| 2016 | $4,744 | $215,090 | $74,070 | $141,020 |
| 2015 | $4,402 | $203,340 | $74,070 | $129,270 |
| 2014 | $4,402 | $203,340 | $74,070 | $129,270 |
| 2013 | -- | $203,340 | $74,070 | $129,270 |
Source: Public Records
Map
Nearby Homes
- 410 E Bandera Rd
- 222 3rd St
- 314 E Bandera Rd
- 504 E Bandera Rd
- 519 E Bandera Rd
- 12 2nd St
- 401 Oak Park Dr
- 312 Frey St
- 307 Frey St
- 603 Oak Park Dr Unit 603
- 530 Oak Park Dr
- 129 Hughs St
- 109 Kenwood Ave
- 629 Oak Park Dr
- 39 Herff Rd
- 315 Hickman St
- 116 Bess St
- 131 Bess St
- 320 Hickman St
- 29218 Angelfish Blvd
- 113 Falls Ct Unit 700
- 113 Falls Ct
- 113 Falls Ct Unit 300
- 113 Falls Ct Unit 800
- 113 Falls Ct Unit 700-800
- 113 Falls Ct Unit 500
- 415 E Bandera Rd
- 109 Falls Ct Unit 100
- 109 Falls Ct Unit 200
- 109 Falls Ct Unit 600
- 419 E Bandera Rd
- 407 E Bandera Rd
- 423 E Bandera Rd
- 403 E Bandera Rd
- 337 E Bandera Rd
- 333 E Bandera Rd
- 329 E Bandera Rd
- 402 E Bandera Rd
- 402 E Bandera Rd
- 105 Falls Ct Unit 300