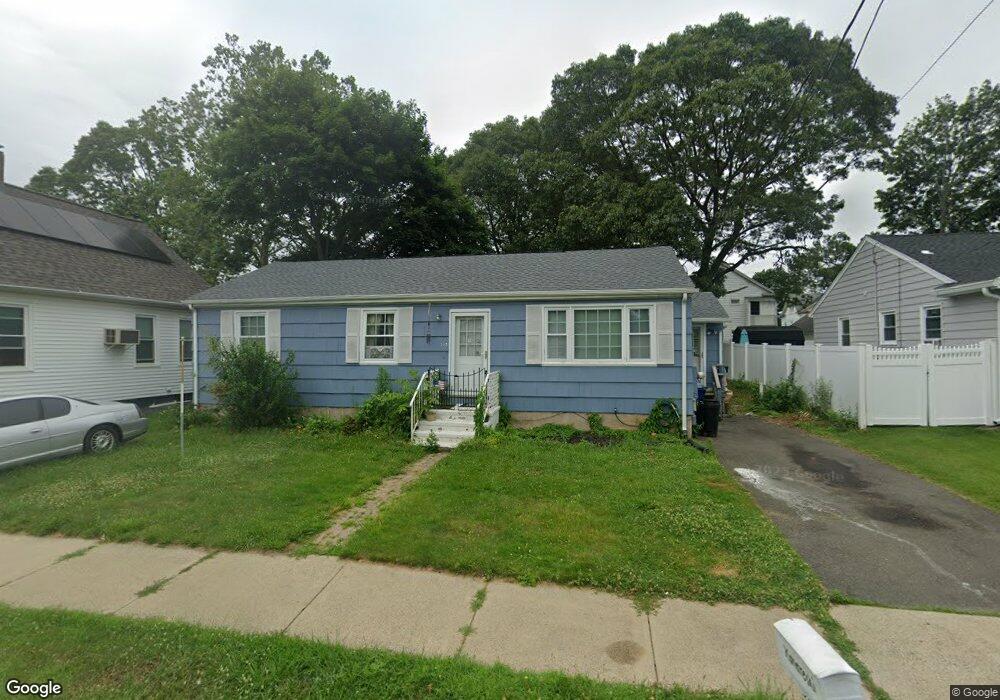
113 Fenwick St West Haven, CT 06516
Allingtown NeighborhoodEstimated Value: $314,000 - $334,000
3
Beds
1
Bath
1,086
Sq Ft
$299/Sq Ft
Est. Value
About This Home
This home is located at 113 Fenwick St, West Haven, CT 06516 and is currently estimated at $324,983, approximately $299 per square foot. 113 Fenwick St is a home located in New Haven County with nearby schools including Carrigan 5/6 Intermediate School, Harry M. Bailey Middle School, and West Haven High School.
Ownership History
Date
Name
Owned For
Owner Type
Purchase Details
Closed on
Jul 24, 2020
Sold by
Konareski Edward and Konareski Laura
Bought by
Konareski Michelle
Current Estimated Value
Home Financials for this Owner
Home Financials are based on the most recent Mortgage that was taken out on this home.
Original Mortgage
$141,600
Outstanding Balance
$125,561
Interest Rate
3.1%
Mortgage Type
New Conventional
Estimated Equity
$199,422
Create a Home Valuation Report for This Property
The Home Valuation Report is an in-depth analysis detailing your home's value as well as a comparison with similar homes in the area
Home Values in the Area
Average Home Value in this Area
Purchase History
| Date | Buyer | Sale Price | Title Company |
|---|---|---|---|
| Konareski Michelle | $177,000 | None Available | |
| Konareski Michelle | $177,000 | None Available |
Source: Public Records
Mortgage History
| Date | Status | Borrower | Loan Amount |
|---|---|---|---|
| Open | Konareski Michelle | $141,600 | |
| Closed | Konareski Michelle | $141,600 |
Source: Public Records
Tax History Compared to Growth
Tax History
| Year | Tax Paid | Tax Assessment Tax Assessment Total Assessment is a certain percentage of the fair market value that is determined by local assessors to be the total taxable value of land and additions on the property. | Land | Improvement |
|---|---|---|---|---|
| 2025 | $6,516 | $191,590 | $59,710 | $131,880 |
| 2024 | $5,679 | $118,580 | $41,370 | $77,210 |
| 2023 | $5,504 | $118,580 | $41,370 | $77,210 |
| 2022 | $5,408 | $118,580 | $41,370 | $77,210 |
| 2021 | $5,410 | $118,580 | $41,370 | $77,210 |
| 2020 | $5,314 | $103,180 | $33,320 | $69,860 |
| 2019 | $5,231 | $103,180 | $33,320 | $69,860 |
| 2018 | $5,089 | $103,180 | $33,320 | $69,860 |
| 2017 | $4,930 | $103,180 | $33,320 | $69,860 |
| 2016 | $4,780 | $103,180 | $33,320 | $69,860 |
| 2015 | $4,418 | $108,570 | $37,100 | $71,470 |
| 2014 | $4,330 | $108,570 | $37,100 | $71,470 |
Source: Public Records
Map
Nearby Homes
- 100 Yates St
- 0 Burwell & Woodfield Rd Unit 24051262
- 0 Burwell Rd
- 50 Morris Ave
- 36 Forest Hills Rd
- 52 Highview Ave
- 56 Highview Ave
- 29 Birch St
- 11 Priscilla Rd
- 78 Nonquit St
- 60 Andrews St
- 38 Chauncey St
- 690 Forest Rd Unit 702
- 690 Forest Rd Unit 392
- 690 Forest Rd Unit 511
- 699 Forest Rd
- 65 Westfield St
- 22 Bristol St
- 103 Gilbert St
- 846 Beechwood Rd
- 125 Fenwick St
- 109 Fenwick St
- 120 Enright St
- 101 Fenwick St
- 133 Fenwick St
- 133 Fenwick St Unit 2
- 114 Fenwick St
- 100 Enright St
- 102 Enright St
- 110 Fenwick St
- 118 Fenwick St
- 97 Fenwick St
- 102 Fenwick St
- 91 Enright St
- 132 Fenwick St
- 9 Timberland Dr
- 125 Enright St
- 105 Enright St
- 87 Fenwick St
- 61 Monteith St