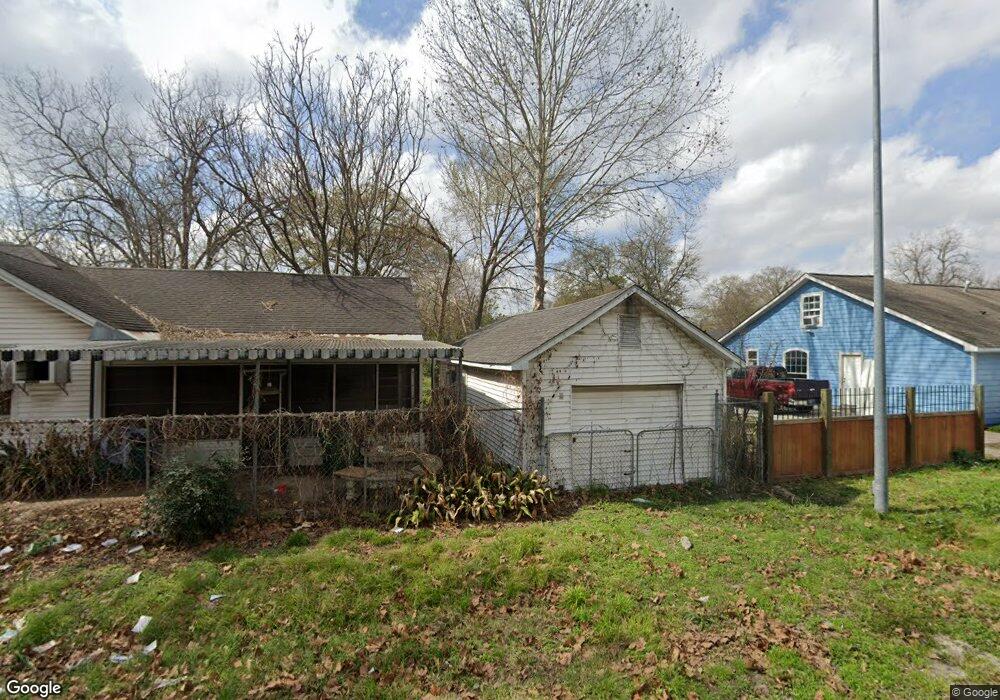
113 Fichter St Houston, TX 77022
Northside-Northline NeighborhoodEstimated Value: $178,522 - $247,000
3
Beds
1
Bath
1,273
Sq Ft
$169/Sq Ft
Est. Value
About This Home
This home is located at 113 Fichter St, Houston, TX 77022 and is currently estimated at $215,631, approximately $169 per square foot. 113 Fichter St is a home located in Harris County with nearby schools including Burbank Elementary School, Burbank Middle School, and Sam Houston Math, Science & Technology Center.
Ownership History
Date
Name
Owned For
Owner Type
Purchase Details
Closed on
Sep 27, 2023
Sold by
Joyner Kathleen Marie and Joyner Darrell Wayne
Bought by
Montalvo Jose Cruz Alanis and Mata Julia Jasmin
Current Estimated Value
Purchase Details
Closed on
Jan 16, 2017
Sold by
Nailor Eleanor P
Bought by
Nailor Clarence E and Nailor Eleanor P
Purchase Details
Closed on
Oct 5, 2016
Sold by
Bryer Mary L and Bryer Mary Linda
Bought by
Nallor Eleanor P
Create a Home Valuation Report for This Property
The Home Valuation Report is an in-depth analysis detailing your home's value as well as a comparison with similar homes in the area
Home Values in the Area
Average Home Value in this Area
Purchase History
| Date | Buyer | Sale Price | Title Company |
|---|---|---|---|
| Montalvo Jose Cruz Alanis | -- | Declaration Title | |
| Nailor Clarence E | -- | Title Co Llc | |
| Nallor Eleanor P | -- | None Available |
Source: Public Records
Tax History Compared to Growth
Tax History
| Year | Tax Paid | Tax Assessment Tax Assessment Total Assessment is a certain percentage of the fair market value that is determined by local assessors to be the total taxable value of land and additions on the property. | Land | Improvement |
|---|---|---|---|---|
| 2025 | $2,966 | $149,283 | $76,000 | $73,283 |
| 2024 | $2,966 | $141,758 | $69,750 | $72,008 |
| 2023 | $3,147 | $156,170 | $42,500 | $113,670 |
| 2022 | $2,900 | $131,722 | $42,500 | $89,222 |
| 2021 | $2,521 | $108,182 | $42,500 | $65,682 |
| 2020 | $2,451 | $101,211 | $42,500 | $58,711 |
| 2019 | $2,455 | $97,013 | $35,000 | $62,013 |
| 2018 | $2,009 | $79,395 | $29,250 | $50,145 |
| 2017 | $2,008 | $0 | $0 | $0 |
| 2016 | $1,734 | $75,662 | $27,500 | $48,162 |
| 2015 | $1,124 | $63,060 | $20,000 | $43,060 |
| 2014 | $1,124 | $63,060 | $20,000 | $43,060 |
Source: Public Records
Map
Nearby Homes
- 108 Fichter St
- 216 Burress St
- 132 Grothe Ln
- 90 Burress St Unit B
- 90 Burress St Unit A
- 249 De Boll St
- 253 De Boll St
- 61 Trenwood Ln
- 70 Burress St
- 56 Wellford St
- 318 Charlock St
- 44 Farrell St
- 45 Wellford St
- 411 Berry Rd
- 9026 Mcgallion Rd
- 202 Burbank St
- 235 Julia St Unit B
- 88 Berry Rd
- 9625 Fulton St
- 240 Julia St Unit D