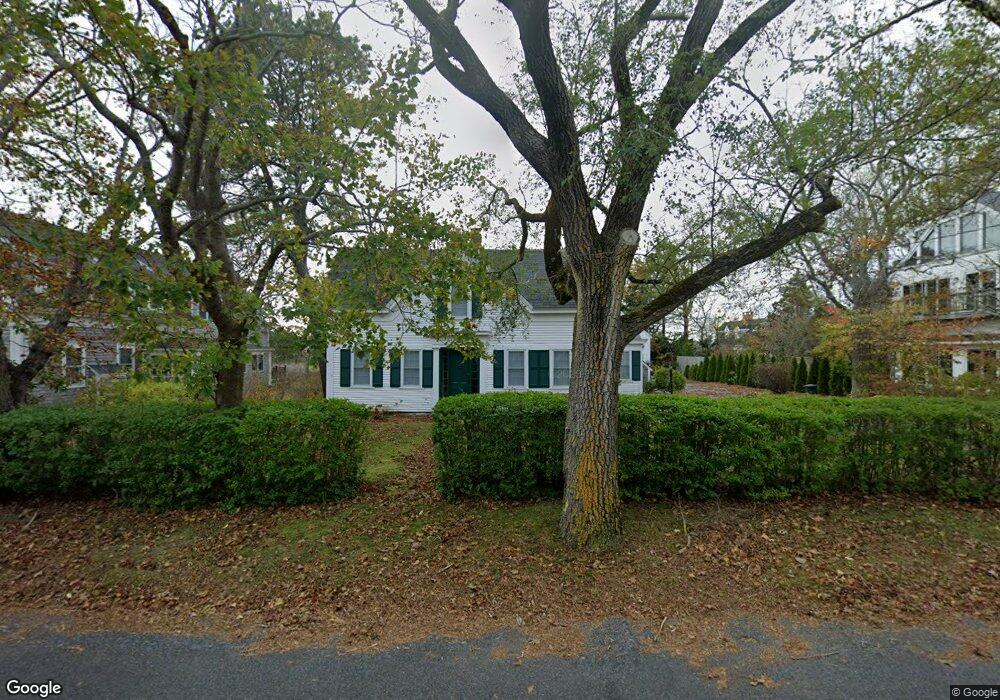
113 Fisk St West Dennis, MA 02670
West Dennis NeighborhoodEstimated Value: $761,000 - $1,208,087
4
Beds
2
Baths
1,801
Sq Ft
$536/Sq Ft
Est. Value
About This Home
This home is located at 113 Fisk St, West Dennis, MA 02670 and is currently estimated at $964,772, approximately $535 per square foot. 113 Fisk St is a home located in Barnstable County with nearby schools including Dennis-Yarmouth Regional High School and St. Pius X. School.
Ownership History
Date
Name
Owned For
Owner Type
Purchase Details
Closed on
Jun 11, 2021
Sold by
King John F and King Patricia A
Bought by
King Ft
Current Estimated Value
Purchase Details
Closed on
Nov 15, 2000
Sold by
Sheehan Kevin J
Bought by
King John F and King Patricia A
Home Financials for this Owner
Home Financials are based on the most recent Mortgage that was taken out on this home.
Original Mortgage
$38,000
Interest Rate
7.64%
Create a Home Valuation Report for This Property
The Home Valuation Report is an in-depth analysis detailing your home's value as well as a comparison with similar homes in the area
Home Values in the Area
Average Home Value in this Area
Purchase History
| Date | Buyer | Sale Price | Title Company |
|---|---|---|---|
| King Ft | -- | None Available | |
| King John F | $365,000 | -- |
Source: Public Records
Mortgage History
| Date | Status | Borrower | Loan Amount |
|---|---|---|---|
| Previous Owner | King John F | $251,300 | |
| Previous Owner | King John F | $38,000 | |
| Previous Owner | King John F | $252,700 |
Source: Public Records
Tax History Compared to Growth
Tax History
| Year | Tax Paid | Tax Assessment Tax Assessment Total Assessment is a certain percentage of the fair market value that is determined by local assessors to be the total taxable value of land and additions on the property. | Land | Improvement |
|---|---|---|---|---|
| 2025 | $4,103 | $947,500 | $463,400 | $484,100 |
| 2024 | $3,968 | $903,900 | $445,700 | $458,200 |
| 2023 | $3,838 | $821,900 | $405,100 | $416,800 |
| 2022 | $3,779 | $674,900 | $365,000 | $309,900 |
| 2021 | $3,946 | $654,400 | $357,800 | $296,600 |
| 2020 | $4,440 | $727,900 | $429,300 | $298,600 |
| 2019 | $4,001 | $648,500 | $350,800 | $297,700 |
| 2018 | $3,809 | $600,800 | $333,900 | $266,900 |
| 2017 | $3,742 | $608,400 | $333,900 | $274,500 |
| 2016 | $3,890 | $595,700 | $360,700 | $235,000 |
| 2015 | $3,812 | $595,700 | $360,700 | $235,000 |
| 2014 | $3,213 | $506,000 | $264,500 | $241,500 |
Source: Public Records
Map
Nearby Homes
- 14 Schoolhouse Ln
- 178 School St
- 23 Doric Ave
- 209 Main St Unit 3
- 209 Main St Unit 6
- 209 Main St Unit 1
- 209 Main St Unit 2
- 209 Main St Unit 4
- 209 Main St Unit 5
- 2 Rita Mary Way
- 401 Main St Unit 201
- 401 Main St Unit 101
- 467 Main St
- 45 Seth Ln
- 308 Old Main St
- 61 Trotters Ln
- 40 Kelley Rd
- 29 Bass River Rd
- 6 Baker Way
- 18 Turner Ln