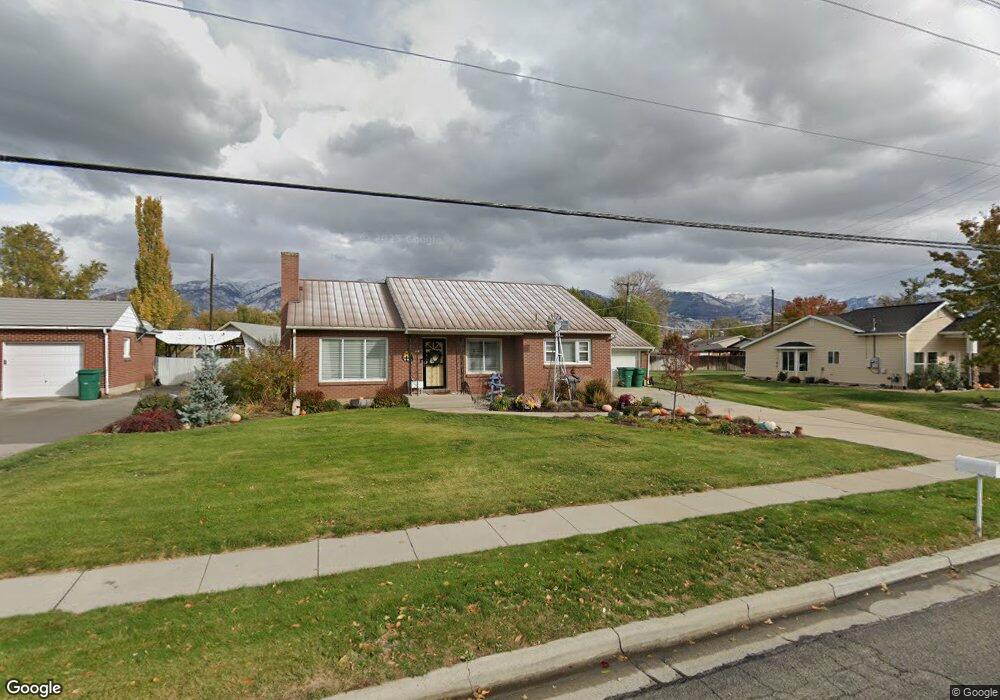
113 Flint St Layton, UT 84041
Estimated Value: $378,000 - $457,000
2
Beds
1
Bath
1,289
Sq Ft
$329/Sq Ft
Est. Value
About This Home
This home is located at 113 Flint St, Layton, UT 84041 and is currently estimated at $423,844, approximately $328 per square foot. 113 Flint St is a home located in Davis County with nearby schools including Layton Elementary School, Fairfield Junior High School, and Layton High School.
Ownership History
Date
Name
Owned For
Owner Type
Purchase Details
Closed on
Nov 16, 2016
Sold by
Cook Cook L and Cook Noreen E
Bought by
Smith Barbara H
Current Estimated Value
Purchase Details
Closed on
Nov 14, 2016
Sold by
Smith Barbara H
Bought by
Smith Sterling D and Smith Barbara H
Create a Home Valuation Report for This Property
The Home Valuation Report is an in-depth analysis detailing your home's value as well as a comparison with similar homes in the area
Home Values in the Area
Average Home Value in this Area
Purchase History
| Date | Buyer | Sale Price | Title Company |
|---|---|---|---|
| Smith Barbara H | -- | Vanguard Title | |
| Cook L Carter | -- | Vanguard Title | |
| Smith Sterling D | -- | Vanguard Title | |
| Smith Barbara H | -- | Vanguard Title | |
| Cook L Carter | -- | Vanguard Title |
Source: Public Records
Tax History Compared to Growth
Tax History
| Year | Tax Paid | Tax Assessment Tax Assessment Total Assessment is a certain percentage of the fair market value that is determined by local assessors to be the total taxable value of land and additions on the property. | Land | Improvement |
|---|---|---|---|---|
| 2025 | $2,431 | $255,200 | $155,789 | $99,411 |
| 2024 | $2,377 | $251,350 | $176,136 | $75,214 |
| 2023 | $2,146 | $400,000 | $206,366 | $193,634 |
| 2022 | $2,331 | $235,950 | $107,557 | $128,393 |
| 2021 | $2,173 | $328,000 | $161,219 | $166,781 |
| 2020 | $1,968 | $285,000 | $141,114 | $143,886 |
| 2019 | $1,911 | $271,000 | $131,349 | $139,651 |
| 2018 | $1,700 | $242,000 | $116,635 | $125,365 |
| 2016 | $1,522 | $111,815 | $52,898 | $58,917 |
| 2015 | $1,509 | $105,215 | $52,898 | $52,317 |
| 2014 | $1,432 | $102,116 | $52,898 | $49,218 |
| 2013 | -- | $91,839 | $42,925 | $48,914 |
Source: Public Records
Map
Nearby Homes