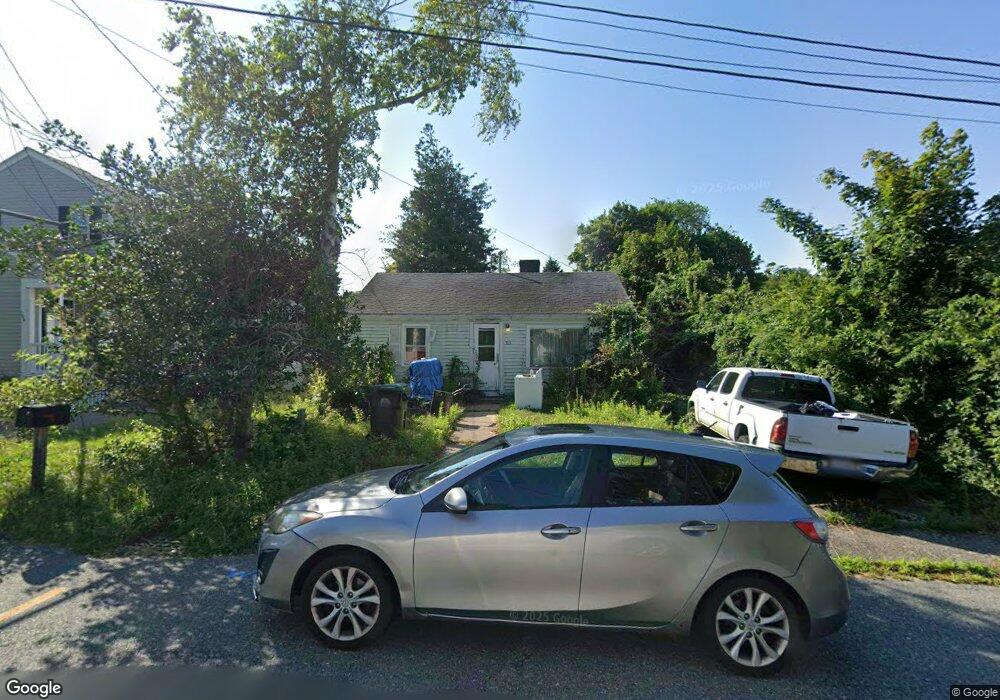
113 Franklin St Marshfield, MA 02050
Ocean Bluff-Brant Rock NeighborhoodEstimated Value: $462,000 - $812,000
2
Beds
1
Bath
952
Sq Ft
$621/Sq Ft
Est. Value
About This Home
This home is located at 113 Franklin St, Marshfield, MA 02050 and is currently estimated at $591,549, approximately $621 per square foot. 113 Franklin St is a home located in Plymouth County with nearby schools including Governor Edward Winslow School, Furnace Brook Middle School, and Marshfield High School.
Ownership History
Date
Name
Owned For
Owner Type
Purchase Details
Closed on
May 13, 2004
Sold by
Curran Robert T and Madden Phyllis G
Bought by
Curran Robert T
Current Estimated Value
Home Financials for this Owner
Home Financials are based on the most recent Mortgage that was taken out on this home.
Original Mortgage
$83,119
Outstanding Balance
$38,596
Interest Rate
5.47%
Mortgage Type
Purchase Money Mortgage
Estimated Equity
$552,953
Purchase Details
Closed on
May 15, 1997
Sold by
Jackson Tr William J
Bought by
Curran Robert T and Madden Phyllis G
Home Financials for this Owner
Home Financials are based on the most recent Mortgage that was taken out on this home.
Original Mortgage
$86,700
Interest Rate
8.12%
Mortgage Type
Purchase Money Mortgage
Create a Home Valuation Report for This Property
The Home Valuation Report is an in-depth analysis detailing your home's value as well as a comparison with similar homes in the area
Home Values in the Area
Average Home Value in this Area
Purchase History
| Date | Buyer | Sale Price | Title Company |
|---|---|---|---|
| Curran Robert T | -- | -- | |
| Curran Robert T | -- | -- | |
| Curran Robert T | $87,000 | -- | |
| Curran Robert T | $87,000 | -- |
Source: Public Records
Mortgage History
| Date | Status | Borrower | Loan Amount |
|---|---|---|---|
| Open | Curran Robert T | $83,119 | |
| Closed | Curran Robert T | $83,119 | |
| Previous Owner | Curran Robert T | $86,700 |
Source: Public Records
Tax History Compared to Growth
Tax History
| Year | Tax Paid | Tax Assessment Tax Assessment Total Assessment is a certain percentage of the fair market value that is determined by local assessors to be the total taxable value of land and additions on the property. | Land | Improvement |
|---|---|---|---|---|
| 2025 | $4,264 | $430,700 | $319,600 | $111,100 |
| 2024 | $4,197 | $403,900 | $299,700 | $104,200 |
| 2023 | $4,011 | $356,200 | $269,700 | $86,500 |
| 2022 | $4,011 | $309,700 | $229,700 | $80,000 |
| 2021 | $3,845 | $291,500 | $219,700 | $71,800 |
| 2020 | $3,431 | $257,400 | $189,800 | $67,600 |
| 2019 | $3,389 | $253,300 | $189,800 | $63,500 |
| 2018 | $3,387 | $253,300 | $189,800 | $63,500 |
| 2017 | $3,228 | $235,300 | $179,800 | $55,500 |
| 2016 | $3,127 | $225,300 | $169,800 | $55,500 |
| 2015 | $2,992 | $225,100 | $169,800 | $55,300 |
| 2014 | $2,992 | $225,100 | $169,800 | $55,300 |
Source: Public Records
Map
Nearby Homes
- 115 Franklin St
- 109 Franklin St
- 119 Franklin St
- 135 Franklin St
- 105 Franklin St
- 105 Franklin St Unit 1
- 98 Dyke Rd
- 98 Dyke Rd Unit 98
- 33 Tower Ave
- 96 Dyke Rd
- 32 Tower Ave
- 32 Tower Ave Unit 1
- 32 Tower Ave
- 125 Franklin St
- 92 Dyke Rd
- 122 Franklin St
- 97 Franklin St
- 104 Franklin St
- 126 Franklin St
- 88 Dyke Rd