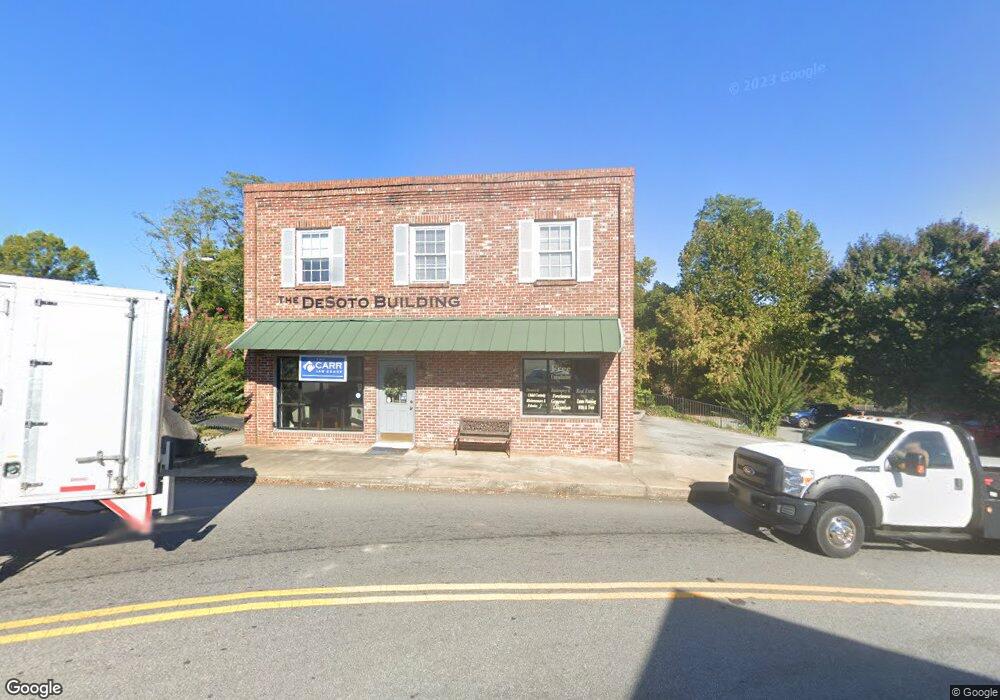
113 Grant St Clarkesville, GA 30523
Estimated Value: $1,217,799
--
Bed
--
Bath
3,100
Sq Ft
$393/Sq Ft
Est. Value
About This Home
This home is located at 113 Grant St, Clarkesville, GA 30523 and is currently estimated at $1,217,799, approximately $392 per square foot. 113 Grant St is a home located in Habersham County with nearby schools including Clarkesville Elementary School, North Habersham Middle School, and Habersham Success Academy.
Ownership History
Date
Name
Owned For
Owner Type
Purchase Details
Closed on
May 1, 2007
Sold by
Not Provided
Bought by
Hobbs William and Hobbs Mary Ann
Current Estimated Value
Create a Home Valuation Report for This Property
The Home Valuation Report is an in-depth analysis detailing your home's value as well as a comparison with similar homes in the area
Home Values in the Area
Average Home Value in this Area
Purchase History
| Date | Buyer | Sale Price | Title Company |
|---|---|---|---|
| Hobbs William | $510,000 | -- |
Source: Public Records
Tax History Compared to Growth
Tax History
| Year | Tax Paid | Tax Assessment Tax Assessment Total Assessment is a certain percentage of the fair market value that is determined by local assessors to be the total taxable value of land and additions on the property. | Land | Improvement |
|---|---|---|---|---|
| 2025 | $8,384 | $224,185 | $76,772 | $147,413 |
| 2024 | $5,522 | $212,740 | $80,340 | $132,400 |
| 2023 | $3,561 | $142,424 | $61,800 | $80,624 |
| 2022 | $3,475 | $133,264 | $61,800 | $71,464 |
| 2021 | $3,266 | $125,828 | $57,040 | $68,788 |
| 2020 | $3,185 | $118,412 | $57,040 | $61,372 |
| 2019 | $3,188 | $118,412 | $57,040 | $61,372 |
| 2018 | $3,163 | $118,412 | $57,040 | $61,372 |
| 2017 | $3,186 | $118,624 | $57,040 | $61,584 |
| 2016 | $3,093 | $296,560 | $57,040 | $61,584 |
| 2015 | $3,057 | $296,560 | $57,040 | $61,584 |
| 2014 | $3,114 | $296,560 | $57,040 | $61,584 |
| 2013 | -- | $118,624 | $57,040 | $61,584 |
Source: Public Records
Map
Nearby Homes
- 449 E Water St
- 447 E Water St
- 451 E Water St
- 206 Sycamore Way
- 701 Wildwood Cir
- 0 Highlands Lake Trail Unit LOT 30 10600443
- 0 Highlands Lake Trail Unit 7646133
- 325 Springwood Dr
- 0 Ivy Ridge Way Unit LOT 40 10327774
- 0 Ivy Ridge Way Unit LOT 6 10487513
- 0 Ivy Ridge Way Unit LOT 50 10487398
- 112 Woodland St
- 551 W Water St
- 214 Old Clarkesville Mill Rd Unit B
- 176 Llewellyn St
- 172 Llewellyn St
- 180 Llewellyn St
- 117 Village Green Way
- 213 N Laurel Dr
- 555 Highway 197 N
- 126 Grant St
- 135 Grant St
- 130 Grant St Unit 9,10
- 130 Grant St
- 159 Grant St
- 234 Bridge St
- 210 Bridge St
- 1475 Washington St
- 1456 Washington St
- 252 Georgia 197
- 200 Highway 197 N
- 200 Hwy 197 N
- 0 Dreamers Ln Unit 8231587
- 0 Dreamers Ln
- 290 Bridge St
- 207 Dreamers Ln
- 1547 Washington St
- 0 Grant St Unit 8184381
- 0 Grant St Unit 7201247
- 0 Grant St Unit 7541663