Estimated Value: $358,000 - $430,948
3
Beds
3
Baths
1,771
Sq Ft
$222/Sq Ft
Est. Value
About This Home
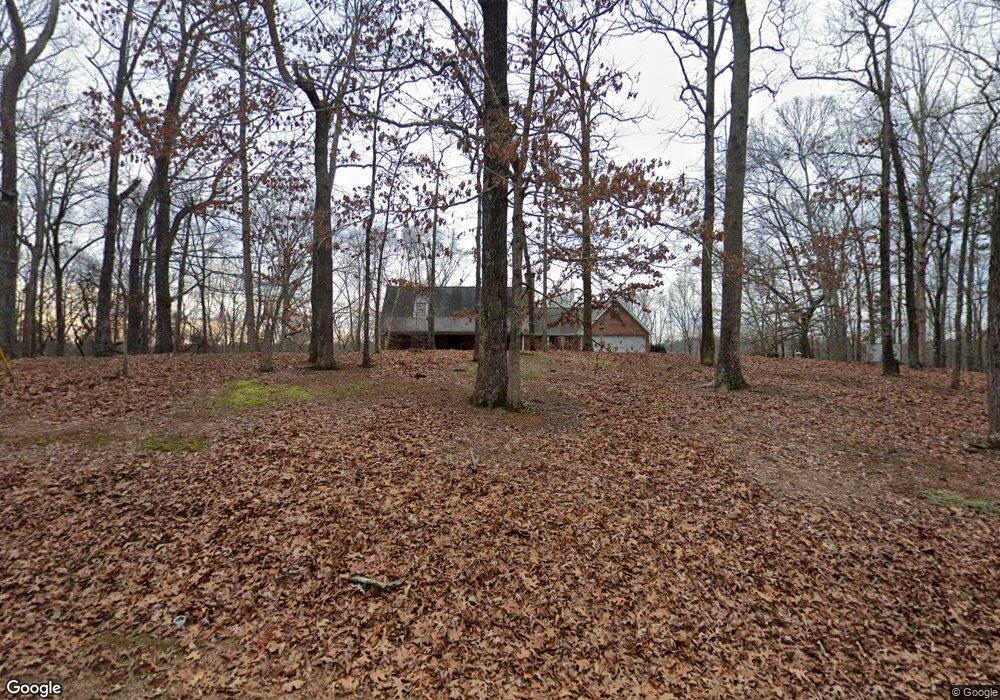
This home is located at 113 Hale Mountain Ct, Hiram, GA 30141 and is currently estimated at $392,487, approximately $221 per square foot. 113 Hale Mountain Ct is a home located in Paulding County with nearby schools including Sam D. Panter Elementary School, J. A. Dobbins Middle School, and Hiram High School.
Ownership History
Date
Name
Owned For
Owner Type
Purchase Details
Closed on
Mar 13, 2015
Sold by
Barrett Homer W and Barrett Linda G
Current Estimated Value
Purchase Details
Closed on
Aug 20, 2002
Sold by
Barrett Homer W and Barrett Linda G
Bought by
Barrett Homer and Barrett Linda G
Home Financials for this Owner
Home Financials are based on the most recent Mortgage that was taken out on this home.
Original Mortgage
$166,500
Interest Rate
6.27%
Mortgage Type
VA
Purchase Details
Closed on
Jun 28, 2002
Sold by
Mclean Bruce P and Mclean Renee A
Bought by
Michael Stacy and Michael Laura R
Home Financials for this Owner
Home Financials are based on the most recent Mortgage that was taken out on this home.
Original Mortgage
$166,500
Interest Rate
6.27%
Mortgage Type
VA
Purchase Details
Closed on
Oct 4, 1996
Sold by
Harvest Mtg
Bought by
Seagraves Preston T
Create a Home Valuation Report for This Property
The Home Valuation Report is an in-depth analysis detailing your home's value as well as a comparison with similar homes in the area
Home Values in the Area
Average Home Value in this Area
Purchase History
| Date | Buyer | Sale Price | Title Company |
|---|---|---|---|
| -- | -- | -- | |
| Barrett Homer | -- | -- | |
| Michael Stacy | $54,800 | -- | |
| Seagraves Preston T | $26,000 | -- |
Source: Public Records
Mortgage History
| Date | Status | Borrower | Loan Amount |
|---|---|---|---|
| Previous Owner | Barrett Homer | $166,500 | |
| Previous Owner | Michael Stacy | $250,000 |
Source: Public Records
Tax History Compared to Growth
Tax History
| Year | Tax Paid | Tax Assessment Tax Assessment Total Assessment is a certain percentage of the fair market value that is determined by local assessors to be the total taxable value of land and additions on the property. | Land | Improvement |
|---|---|---|---|---|
| 2024 | $1,112 | $162,980 | $46,800 | $116,180 |
| 2023 | $1,235 | $154,480 | $45,600 | $108,880 |
| 2022 | $1,115 | $137,972 | $37,920 | $100,052 |
| 2021 | $1,080 | $108,740 | $29,680 | $79,060 |
| 2020 | $1,048 | $99,724 | $28,040 | $71,684 |
| 2019 | $1,033 | $94,804 | $29,680 | $65,124 |
| 2018 | $929 | $86,580 | $28,160 | $58,420 |
| 2017 | $881 | $79,520 | $26,960 | $52,560 |
| 2016 | $1,142 | $61,649 | $24,440 | $37,209 |
| 2015 | $1,171 | $61,649 | $24,440 | $37,209 |
| 2014 | $1,259 | $63,752 | $24,440 | $39,312 |
| 2013 | -- | $62,800 | $26,800 | $36,000 |
Source: Public Records
Map
Nearby Homes
- 185 Hale Mountain Ct
- 61 Hale Mountain Ct
- 180 Hale Mountain Ct
- 60 Hale Mountain Ct
- 650 Davis Rd
- 217 Hale Mountain Ct
- 130 Hale Mountain Ct
- 538 Davis Rd
- 255 Hale Mountain Ct
- 278 Hale Mountain Ct
- 350 Riverstone Dr
- 541 Davis Rd
- 404 Davis Rd
- 404 Lynn Dr
- 347 Riverstone Dr
- 46 Davis Rd
- 365 Hale Mountain Ct
- 645 Davis Rd
- 463 Davis Rd
- 346 Riverstone Dr