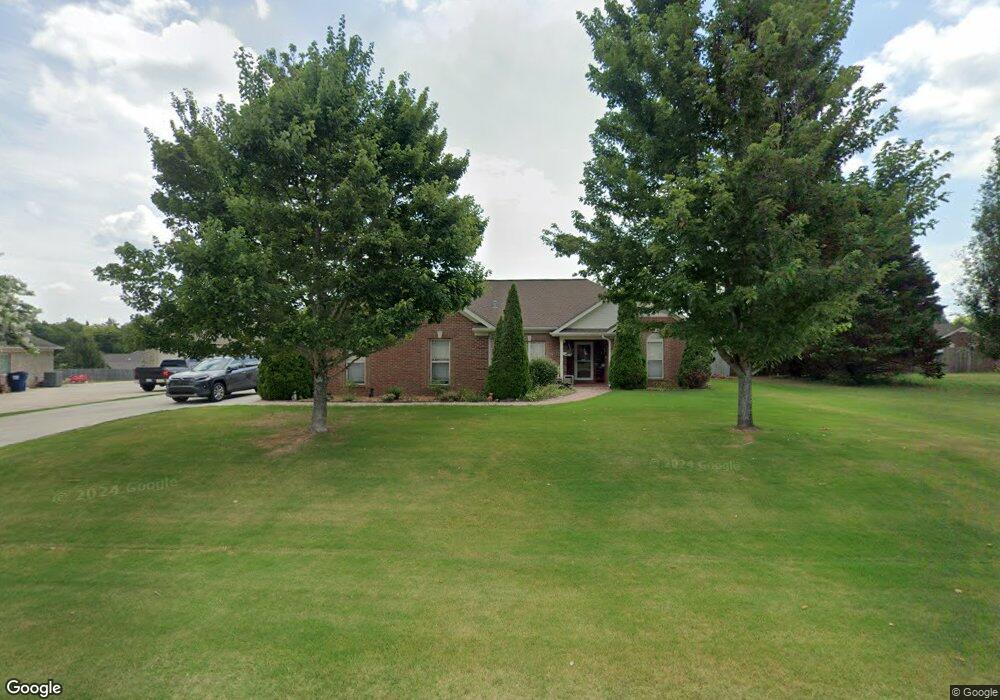
113 Haley Morgan Dr Huntsville, AL 35811
Ryland NeighborhoodEstimated Value: $301,000 - $350,000
3
Beds
2
Baths
1,661
Sq Ft
$192/Sq Ft
Est. Value
About This Home
This home is located at 113 Haley Morgan Dr, Huntsville, AL 35811 and is currently estimated at $319,554, approximately $192 per square foot. 113 Haley Morgan Dr is a home located in Madison County with nearby schools including Central School and Madison County High School.
Ownership History
Date
Name
Owned For
Owner Type
Purchase Details
Closed on
Jun 22, 2013
Sold by
Smith Carrol E and Smith Gary Allan
Bought by
Smith Gary Allen and Smith Carrol L
Current Estimated Value
Home Financials for this Owner
Home Financials are based on the most recent Mortgage that was taken out on this home.
Original Mortgage
$149,430
Outstanding Balance
$70,610
Interest Rate
3.53%
Mortgage Type
VA
Estimated Equity
$248,944
Purchase Details
Closed on
Aug 13, 2009
Sold by
Barcala Jessie J and Barcala Amy L
Bought by
Smith Gary Allan and Smith Carrol E
Home Financials for this Owner
Home Financials are based on the most recent Mortgage that was taken out on this home.
Original Mortgage
$160,000
Interest Rate
5.11%
Mortgage Type
VA
Purchase Details
Closed on
May 25, 2006
Sold by
Wal Bilt Inc
Bought by
Barcala Ii Jessie J and Barcala Amy L
Home Financials for this Owner
Home Financials are based on the most recent Mortgage that was taken out on this home.
Original Mortgage
$152,714
Interest Rate
6.44%
Mortgage Type
VA
Create a Home Valuation Report for This Property
The Home Valuation Report is an in-depth analysis detailing your home's value as well as a comparison with similar homes in the area
Home Values in the Area
Average Home Value in this Area
Purchase History
| Date | Buyer | Sale Price | Title Company |
|---|---|---|---|
| Smith Gary Allen | $15,500 | None Available | |
| Smith Gary Allan | -- | -- | |
| Barcala Ii Jessie J | -- | -- |
Source: Public Records
Mortgage History
| Date | Status | Borrower | Loan Amount |
|---|---|---|---|
| Open | Smith Gary Allen | $149,430 | |
| Previous Owner | Smith Gary Allan | $160,000 | |
| Previous Owner | Barcala Ii Jessie J | $152,714 |
Source: Public Records
Tax History Compared to Growth
Tax History
| Year | Tax Paid | Tax Assessment Tax Assessment Total Assessment is a certain percentage of the fair market value that is determined by local assessors to be the total taxable value of land and additions on the property. | Land | Improvement |
|---|---|---|---|---|
| 2024 | $796 | $22,900 | $3,500 | $19,400 |
| 2023 | $777 | $22,380 | $3,500 | $18,880 |
| 2022 | $682 | $20,280 | $3,500 | $16,780 |
| 2021 | $616 | $18,480 | $3,500 | $14,980 |
| 2020 | $578 | $17,440 | $3,500 | $13,940 |
| 2019 | $559 | $16,920 | $3,500 | $13,420 |
| 2018 | $523 | $15,940 | $0 | $0 |
| 2017 | $523 | $15,940 | $0 | $0 |
| 2016 | $523 | $15,940 | $0 | $0 |
| 2015 | $523 | $15,940 | $0 | $0 |
| 2014 | $543 | $16,480 | $0 | $0 |
Source: Public Records
Map
Nearby Homes
- 104 Louise Taylor
- 900 Wes Taylor Rd
- 908 Wess Taylor Rd
- 105 Alice Janes Cir
- 118 Sydney St
- 232 Pops Corner
- 3208 Jordan Farm Cir NE
- 142 River Mill Rd
- 135 River Mill Rd
- 149 Stone River Rd
- 403 Ryland Pike
- 2368 Jordan Rd
- 129 Season Ln
- 118 Stone River Rd
- 114 Gary Glen Blvd
- 143 River Mill Rd
- 100 Stone River Rd
- 100 Green Lite Way
- 106 Green Lite Way
- 102 Green Lite Way
- 115 Haley Morgan Dr
- 101 Louise Taylor
- 103 Louise Taylor
- 117 Haley Morgan Dr
- 112 Haley Morgan Dr
- 808 Wess Taylor Rd
- 105 Louise Taylor Cir
- 110 Haley Morgan Dr
- 816 Wess Taylor Rd
- 100 Louise Taylor Cir
- 800 Wess Taylor Rd
- 108 Haley Morgan Dr
- 828 Wess Taylor Rd
- 790 Wess Taylor Rd
- 836 Wess Taylor Rd
- 764 Wess Taylor Rd
- 105 Haley Morgan Dr
- 776 Wess Taylor Rd
- 844 Wess Taylor Rd